Observability for LangGraph with Opik
Opik provides a seamless integration with LangGraph, allowing you to easily log and trace your LangGraph-based applications. By using the OpikTracer callback, you can automatically capture detailed information about your LangGraph graph executions during both development and production.
Account Setup
Comet provides a hosted version of the Opik platform, simply create an account and grab your API Key.
You can also run the Opik platform locally, see the installation guide for more information.
Getting Started
Installation
To use the OpikTracer with LangGraph, you’ll need to have both the opik and langgraph packages installed. You can install them using pip:
Configuring Opik
Configure the Opik Python SDK for your deployment type. See the Python SDK Configuration guide for detailed instructions on:
- CLI configuration:
opik configure - Code configuration:
opik.configure() - Self-hosted vs Cloud vs Enterprise setup
- Configuration files and environment variables
Using Opik with LangGraph
Opik provides two ways to track LangGraph applications. We recommend using the track_langgraph function for a simpler experience, but you can also use the OpikTracer callback directly if you need more control.
Option 1: Using track_langgraph (Recommended)
The simplest way to track your LangGraph applications is using the track_langgraph function. This function wraps your compiled graph once, and all subsequent invocations are automatically tracked without needing to pass callbacks:
This is similar to how other Opik integrations work (like OpenAI, Anthropic, etc.), where you wrap the client or object once and then use it normally.
Option 2: Using OpikTracer callback
If you need more fine-grained control or want to use different tracers for different invocations, you can use the OpikTracer callback directly:
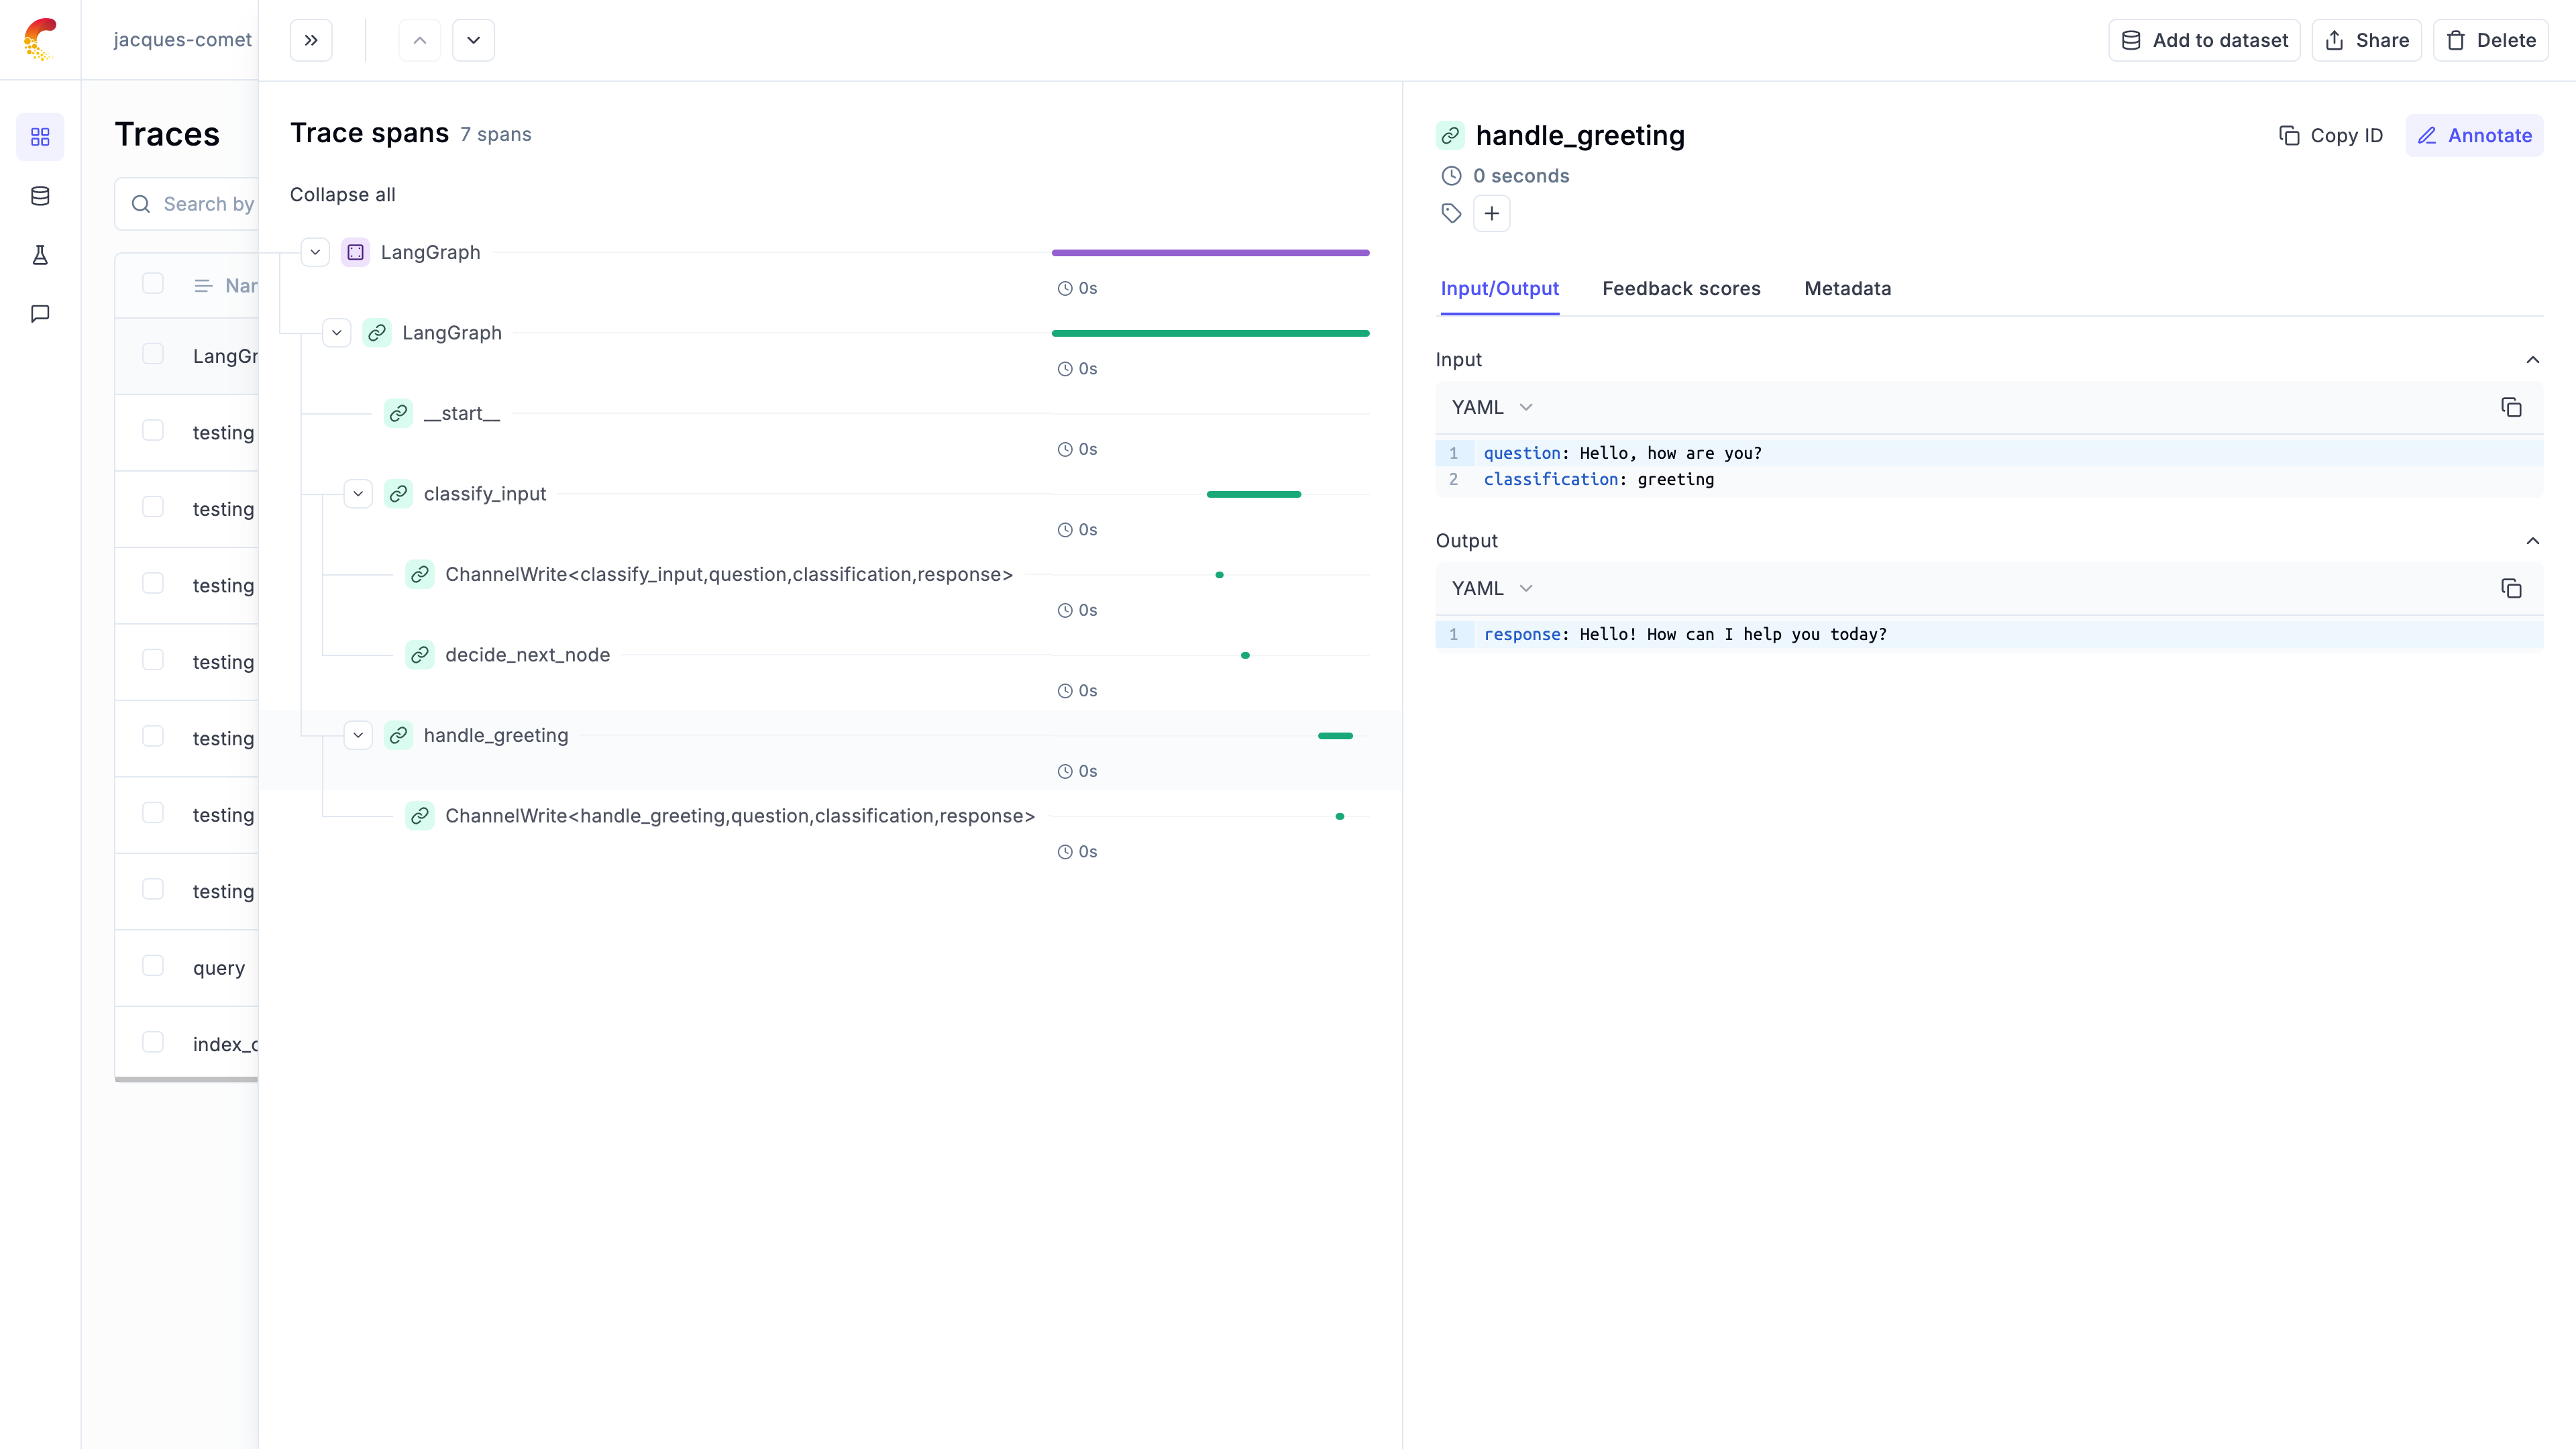
Viewing Traces in the UI
Once tracking is enabled using either method, you will start to see the traces in the Opik UI:
Practical Example: Classification Workflow
Let’s walk through a real-world example of using LangGraph with Opik for a classification workflow. This example demonstrates how to create a graph with conditional routing and track its execution.
Setting up the Environment
First, let’s set up our environment with the necessary dependencies:
Creating the LangGraph Workflow
We’ll create a LangGraph workflow with 3 nodes that demonstrates conditional routing:
Executing with Opik Tracing
Now let’s execute the workflow with Opik tracing enabled using track_langgraph:
The graph execution is now logged on the Opik platform and can be viewed in the UI. The trace will show the complete execution path through the graph, including the classification decision and the chosen response path.
Compatibility with Opik tracing context
LangGraph tracing integrates seamlessly with Opik’s tracing context, allowing you to call @track-decorated functions (and most use most of other native Opik integrations) from within your graph nodes and have them automatically attached to the trace tree.
Synchronous execution (invoke)
For synchronous graph execution using invoke(), everything works out of the box. You can access current spans/traces from LangGraph nodes and call tracked functions inside them:
Asynchronous execution (ainvoke)
For asynchronous graph execution using ainvoke(), you need to explicitly propagate the trace context to @track-decorated functions using the extract_current_langgraph_span_data helper:
Why is this needed for async execution?
This is due to a LangChain framework limitation that doesn’t automatically share the execution context between callbacks (like OpikTracer) and node code in async scenarios. The explicit trace context propagation via distributed headers is required for seamless tracking across async boundaries.
Alternatively, if you don’t want to use the @track decorator, you can use the opik.start_as_current_span context manager with distributed headers:
Logging threads
When you are running multi-turn conversations using LangGraph persistence, Opik will use Langgraph’s thread_id as Opik thread_id. Here is an example below:
Updating logged traces
You can use the OpikTracer.created_traces method to access the trace IDs collected by the OpikTracer callback:
These can then be used with the Opik.log_traces_feedback_scores method to update the logged traces.
Advanced usage
The OpikTracer object has a flush method that can be used to make sure that all traces are logged to the Opik platform before you exit a script. This method will return once all traces have been logged or if the timeout is reach, whichever comes first.