Log traces
If you are just getting started with Opik, we recommend first checking out the Quickstart guide that will walk you through the process of logging your first LLM call.
LLM applications are complex systems that do more than just call an LLM API, they will often involve retrieval, pre-processing and post-processing steps. Tracing is a tool that helps you understand the flow of your application and identify specific points in your application that may be causing issues.
Opik’s tracing functionality allows you to track not just all the LLM calls made by your application but also any of the other steps involved.
Opik supports agent observability using our Typescript SDK, Python SDK, first class OpenTelemetry support and our REST API.
We recommend starting with one of our integrations to get started quickly, you can find a full list of our integrations in the integrations overview page.
We won’t be covering how to track chat conversations in this guide, you can learn more about this in the Logging conversations guide.
Enable agent observability
1. Installing the SDK
Before adding observability to your application, you will first need to install and configure the Opik SDK.
Typescript SDK
Python SDK
OpenTelemetry
You can then set the Opik environment variables in your .env file:
Opik is open-source and can be hosted locally using Docker, please refer to the self-hosting guide to get started. Alternatively, you can use our hosted platform by creating an account on Comet.
2. Using an integration
Once you have installed and configured the Opik SDK, you can start using it to track your agent calls:
OpenAI (TS)
OpenAI (Python)
AI Vercel SDK
ADK
LangGraph
Function Decorators
AI Wizard
Other
Opik has more than 40 integrations with the majority of the popular frameworks and libraries. You can find a full list of integrations in the integrations overview page.
If you would like more control over the logging process, you can use the low-level SDKs to log your traces and spans.
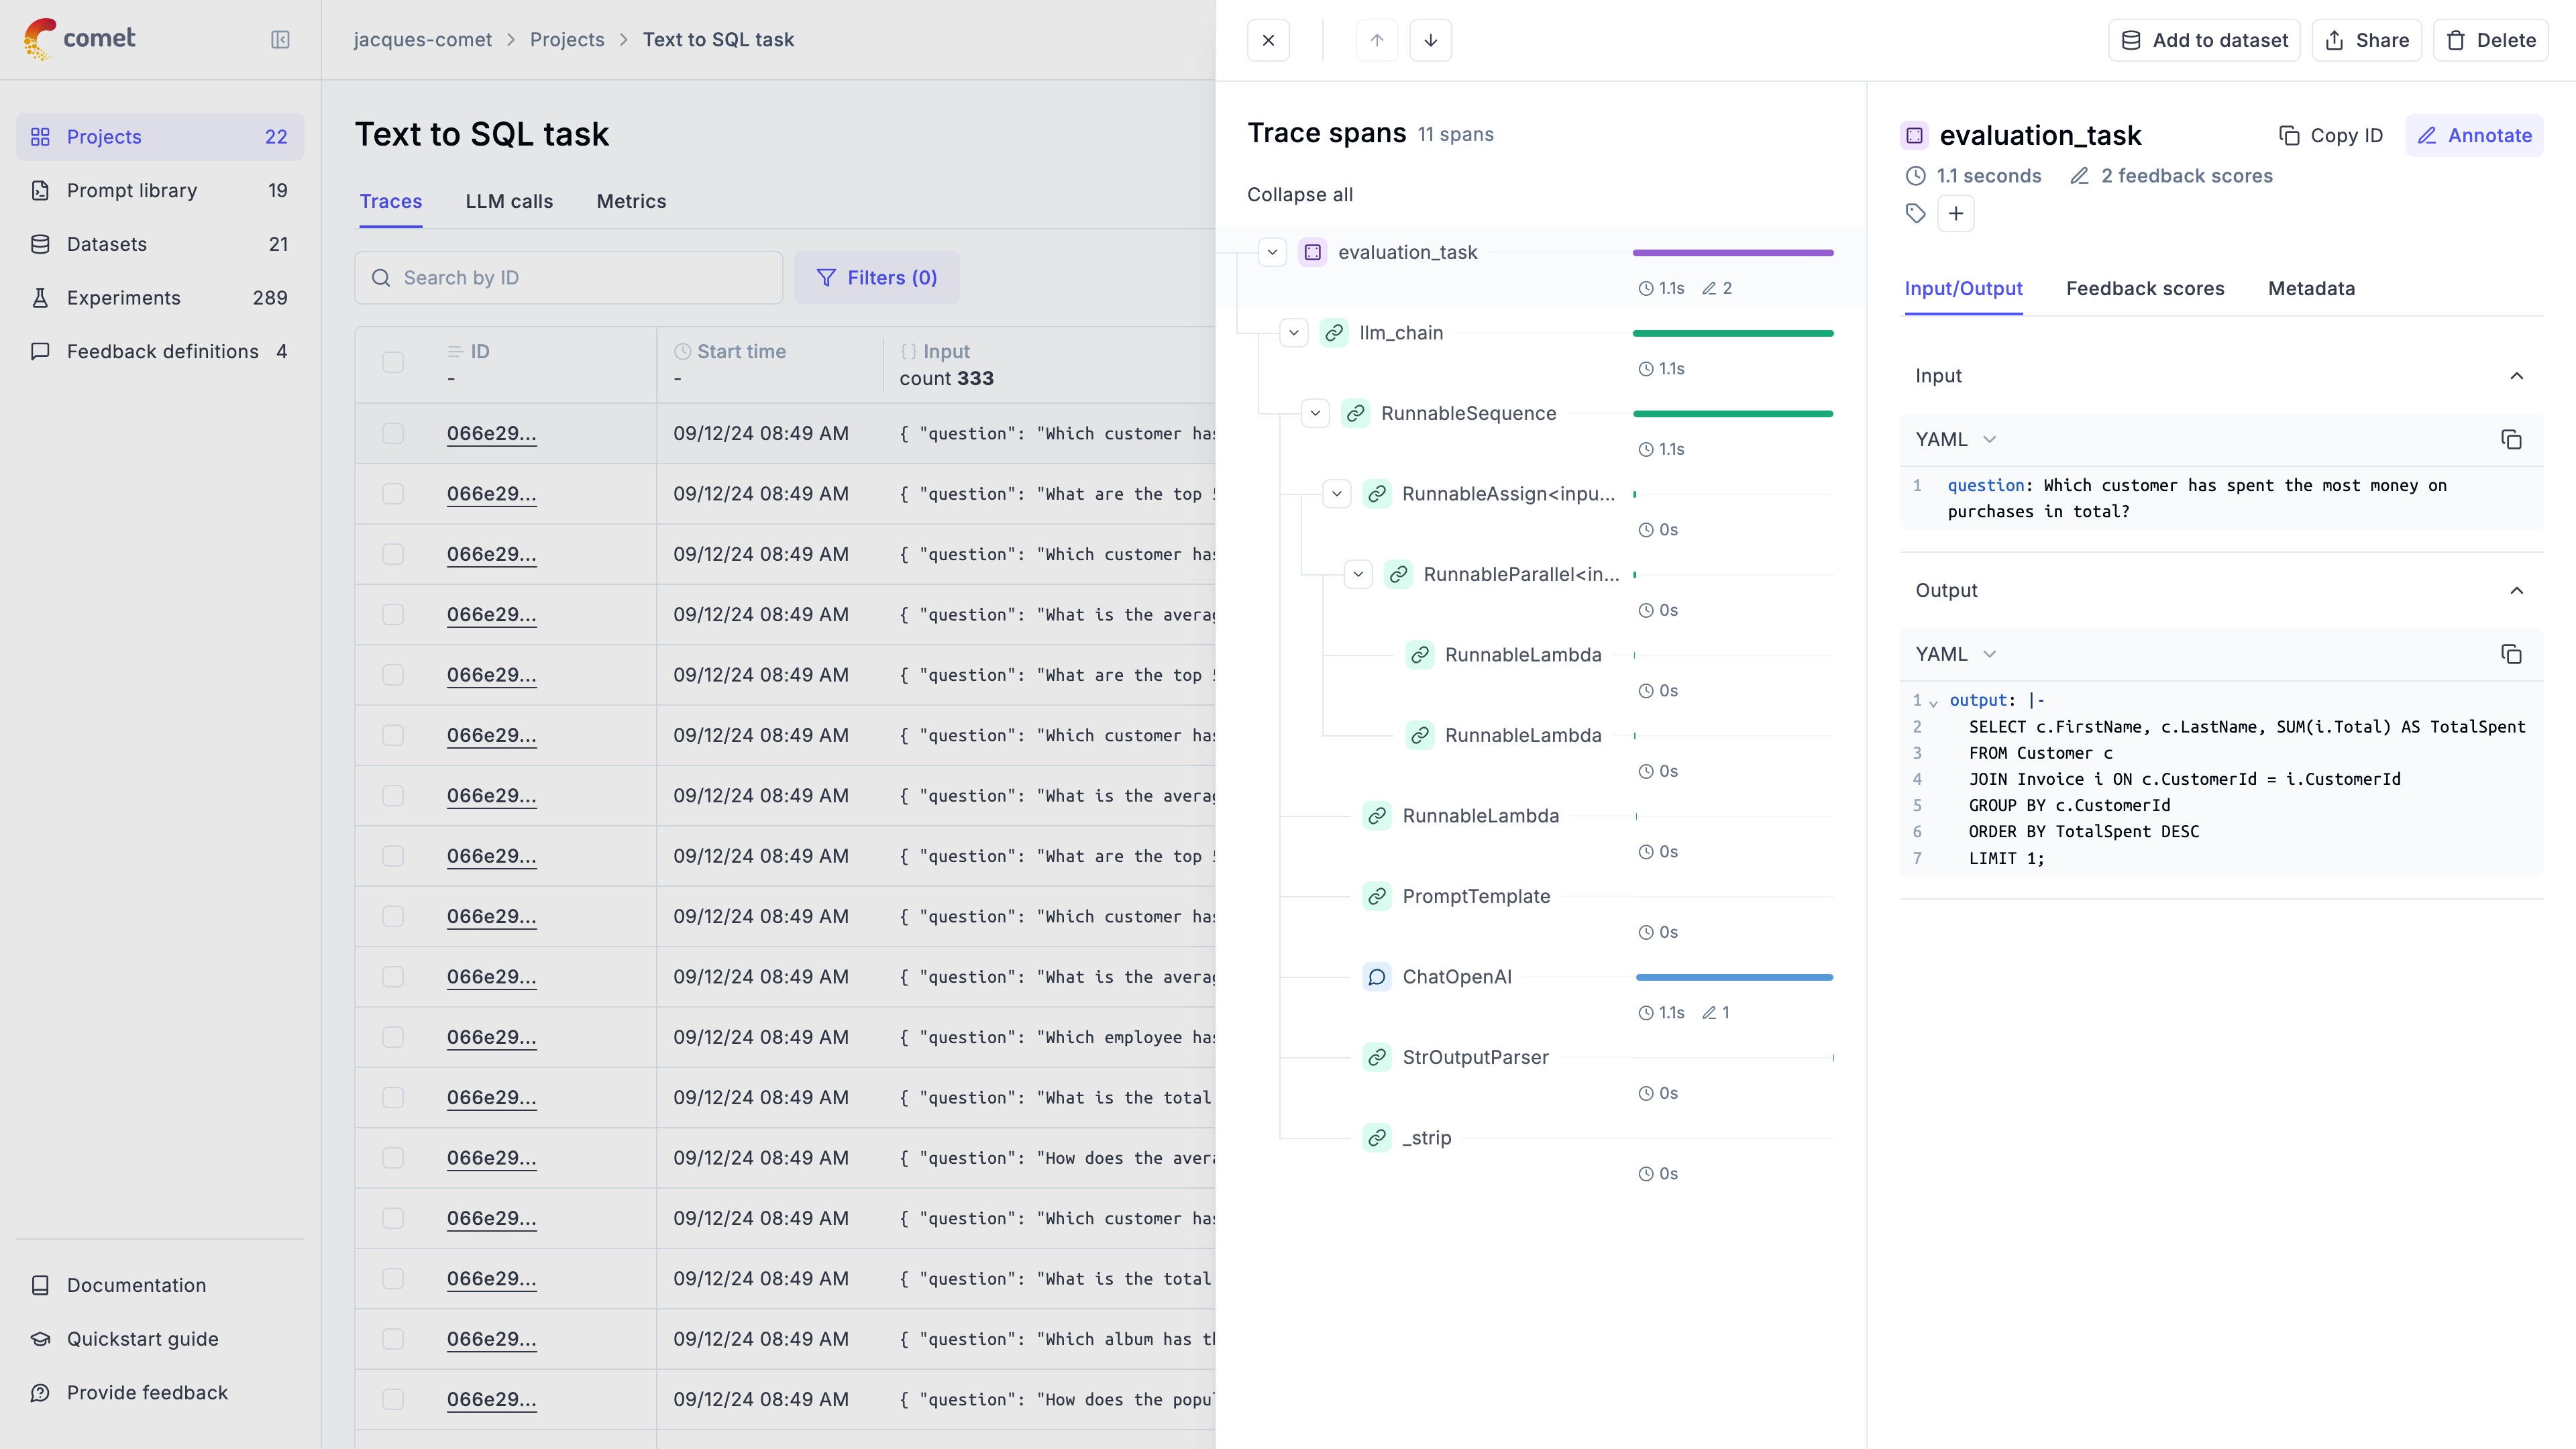
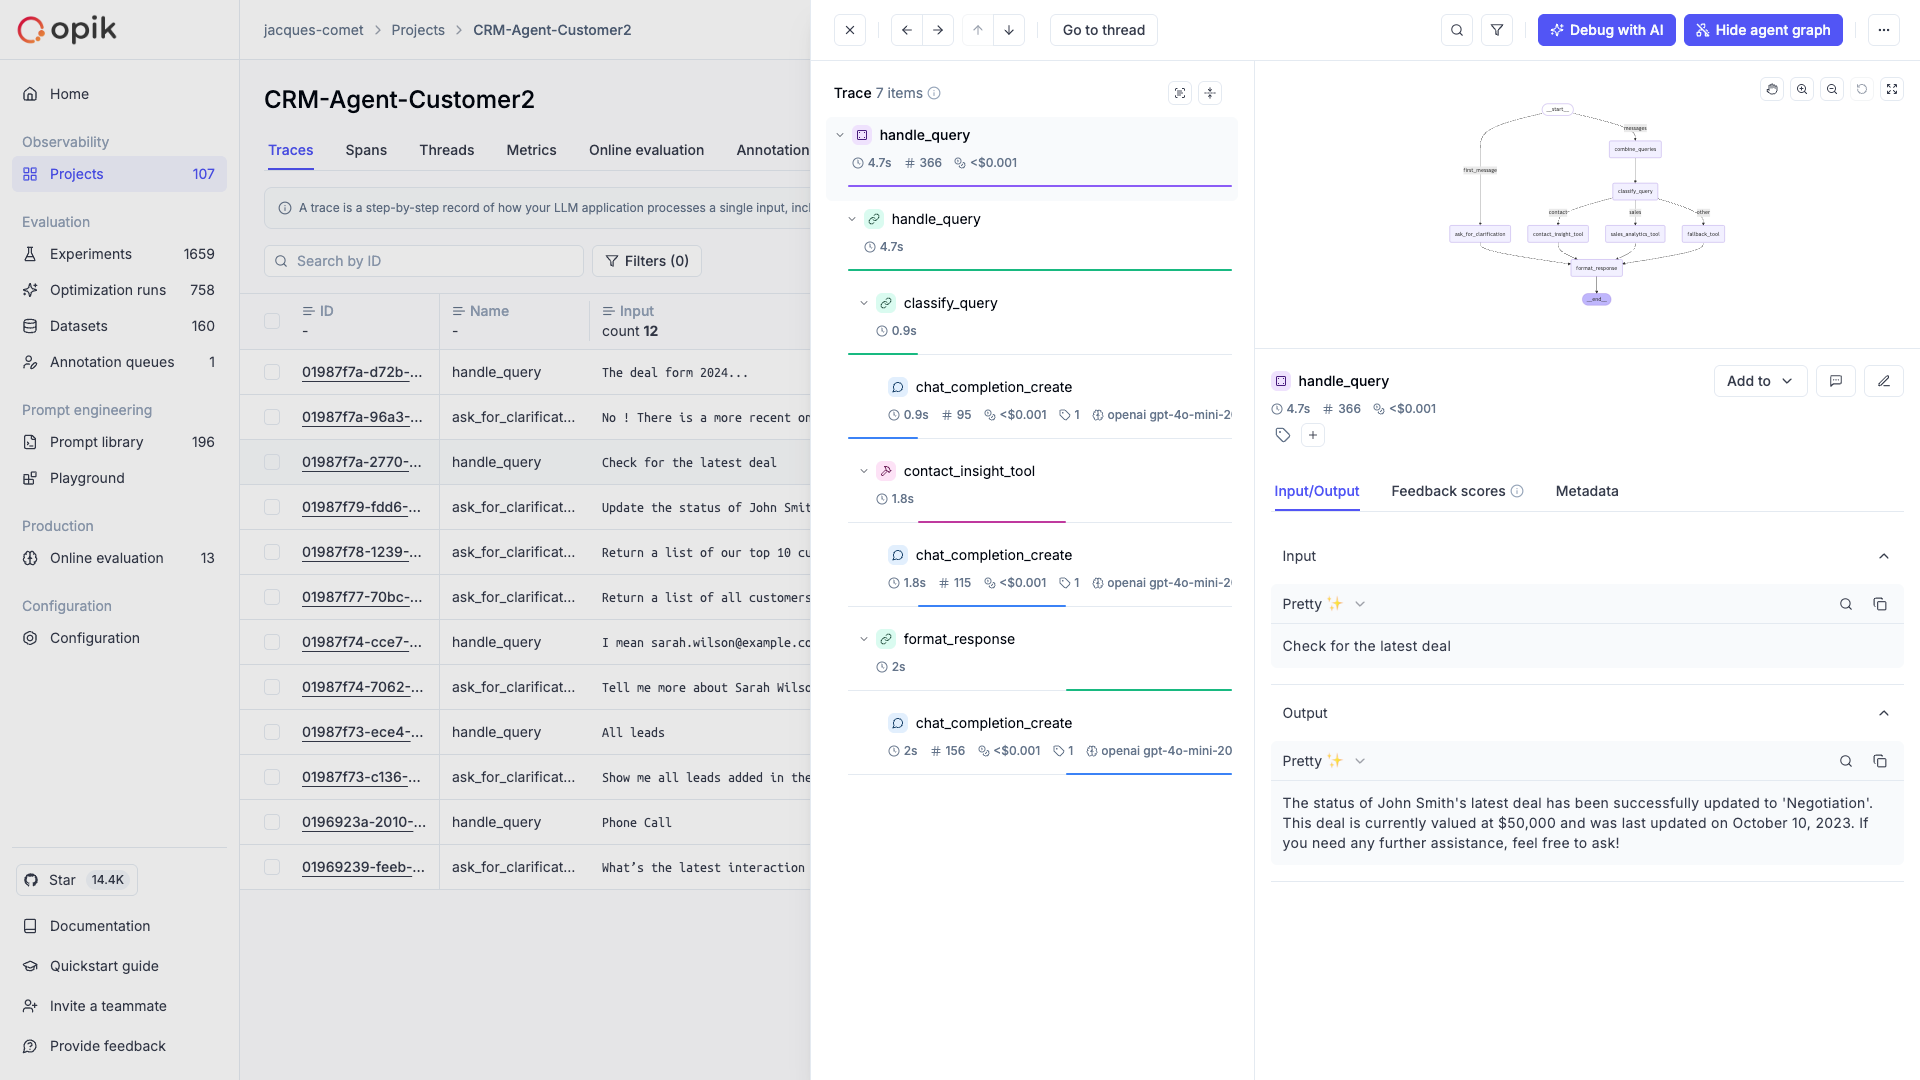
3. Analyzing your agents
Now that you have observability enabled for your agents, you can start to review and analyze the agent calls in Opik. In the Opik UI, you can review each agent call, see the agent graph and review all the tool calls made by the agent.
As a next step, you can create an offline evaluation to evaluate your agent’s performance on a fixed set of samples.
Advanced usage
Using function decorators
Function decorators are a great way to add Opik logging to your existing application. When you add
the @track decorator to a function, Opik will create a span for that function call and log the
input parameters and function output for that function. If we detect that a decorated function
is being called within another decorated function, we will create a nested span for the inner
function.
While decorators are most popular in Python, we also support them in our Typescript SDK:
Typescript
Python
TypeScript started supporting decorators from version 5 but it’s use is still not widespread. The Opik typescript SDK also supports decorators but it’s currently considered experimental.
You can also specify custom tags, metadata, and/or a thread_id for each trace and/or
span logged for the decorated function. For more information, see
Logging additional data using the opik_args parameter
Using the low-level SDKs
If you need full control over the logging process, you can use the low-level SDKs to log your traces and spans:
Typescript
Python
Logging traces/spans using context managers
If you are using the low-level SDKs, you can use the context managers to log traces and spans. Context managers provide a clean and Pythonic way to manage the lifecycle of traces and spans, ensuring proper cleanup and error handling.
Python
Opik provides two main context managers for logging:
opik.start_as_current_trace()
Use this context manager to create and manage a trace. A trace represents the overall execution flow of your application.
For detailed API reference, see opik.start_as_current_trace.
Parameters:
name(str): The name of the traceinput(Dict[str, Any], optional): Input data for the traceoutput(Dict[str, Any], optional): Output data for the tracetags(List[str], optional): Tags to categorize the tracemetadata(Dict[str, Any], optional): Additional metadataproject_name(str, optional): Project name (defaults to environment variable)thread_id(str, optional): Thread identifier for multi-threaded applicationsflush(bool, optional): Whether to flush data immediately (default: False)
opik.start_as_current_span()
Use this context manager to create and manage a span within a trace. Spans represent individual operations or function calls.
For detailed API reference, see opik.start_as_current_span.
Parameters:
name(str): The name of the spantype(SpanType, optional): Type of span (“general”, “tool”, “llm”, “guardrail”, etc.)input(Dict[str, Any], optional): Input data for the spanoutput(Dict[str, Any], optional): Output data for the spantags(List[str], optional): Tags to categorize the spanmetadata(Dict[str, Any], optional): Additional metadataproject_name(str, optional): Project namemodel(str, optional): Model name for LLM spansprovider(str, optional): Provider name for LLM spansflush(bool, optional): Whether to flush data immediately
Nested Context Managers
You can nest spans within traces to create hierarchical structures:
Error Handling
Context managers automatically handle errors and ensure proper cleanup:
Dynamic Parameter Updates
You can modify trace and span parameters both inside and outside the context manager:
Flush Control
Control when data is sent to Opik:
Best Practices
-
Use descriptive names: Choose clear, descriptive names for your traces and spans that explain what they represent.
-
Set appropriate types: Use the correct span types (“llm”, “retrieval”, “general”, etc.) to help with filtering and analysis.
-
Include relevant metadata: Add metadata that will be useful for debugging and analysis, such as model names, parameters, and custom metrics.
-
Handle errors gracefully: Let the context manager handle cleanup, but ensure your application logic handles errors appropriately.
-
Use project organization: Organize your traces by project to keep your Opik dashboard clean and organized.
-
Consider performance: Use
flush=Trueonly when immediate data availability is required, as it can slow down your application by triggering a synchronous, immediate data upload.
Logging to a specific project
By default, traces are logged to the Default Project project. You can change the project you want
the trace to be logged to in a couple of ways:
Typescript
Python
You can use the OPIK_PROJECT_NAME environment variable to set the project you want the trace
to be logged or pass a parameter to the Opik client.
Flushing traces and spans
This process is optional and is only needed if you are running a short-lived script or if you are debugging why traces and spans are not being logged to Opik.
Typescript
Python
As the Typescript SDK has been designed to be used in production environments, we batch traces and spans and send them to Opik in the background.
If you are running a short-lived script, you can flush the traces to Opik by using the
flush method of the Opik client.
Disabling the logging process
Typescript
Python
This is currently not supported in the Typescript SDK. To disable the logging process,
Next steps
Once you have the observability set up for your agent, you can go one step further and: