Observability for LlamaIndex with Opik
LlamaIndex is a flexible data framework for building LLM applications:
LlamaIndex is a “data framework” to help you build LLM apps. It provides the following tools:
- Offers data connectors to ingest your existing data sources and data formats (APIs, PDFs, docs, SQL, etc.).
- Provides ways to structure your data (indices, graphs) so that this data can be easily used with LLMs.
- Provides an advanced retrieval/query interface over your data: Feed in any LLM input prompt, get back retrieved context and knowledge-augmented output.
- Allows easy integrations with your outer application framework (e.g. with LangChain, Flask, Docker, ChatGPT, anything else).
Account Setup
Comet provides a hosted version of the Opik platform, simply create an account and grab your API Key.
You can also run the Opik platform locally, see the installation guide for more information.
Getting Started
Installation
To use the Opik integration with LlamaIndex, you’ll need to have both the opik and llama_index packages installed. You can install them using pip:
Configuring Opik
Configure the Opik Python SDK for your deployment type. See the Python SDK Configuration guide for detailed instructions on:
- CLI configuration:
opik configure - Code configuration:
opik.configure() - Self-hosted vs Cloud vs Enterprise setup
- Configuration files and environment variables
Configuring LlamaIndex
In order to use LlamaIndex, you will need to configure your LLM provider API keys. For this example, we’ll use OpenAI. You can find or create your API keys in these pages:
You can set them as environment variables:
Or set them programmatically:
Using the Opik integration
To use the Opik integration with LLamaIndex, you can use the set_global_handler function from the LlamaIndex package to set the global tracer:
Now that the integration is set up, all the LlamaIndex runs will be traced and logged to Opik.
Alternatively, you can configure the callback handler directly for more control:
The skip_index_construction_trace parameter is useful when you want to track only query operations and not the index construction phase (particularly for large document sets or pre-built indexes)
Example
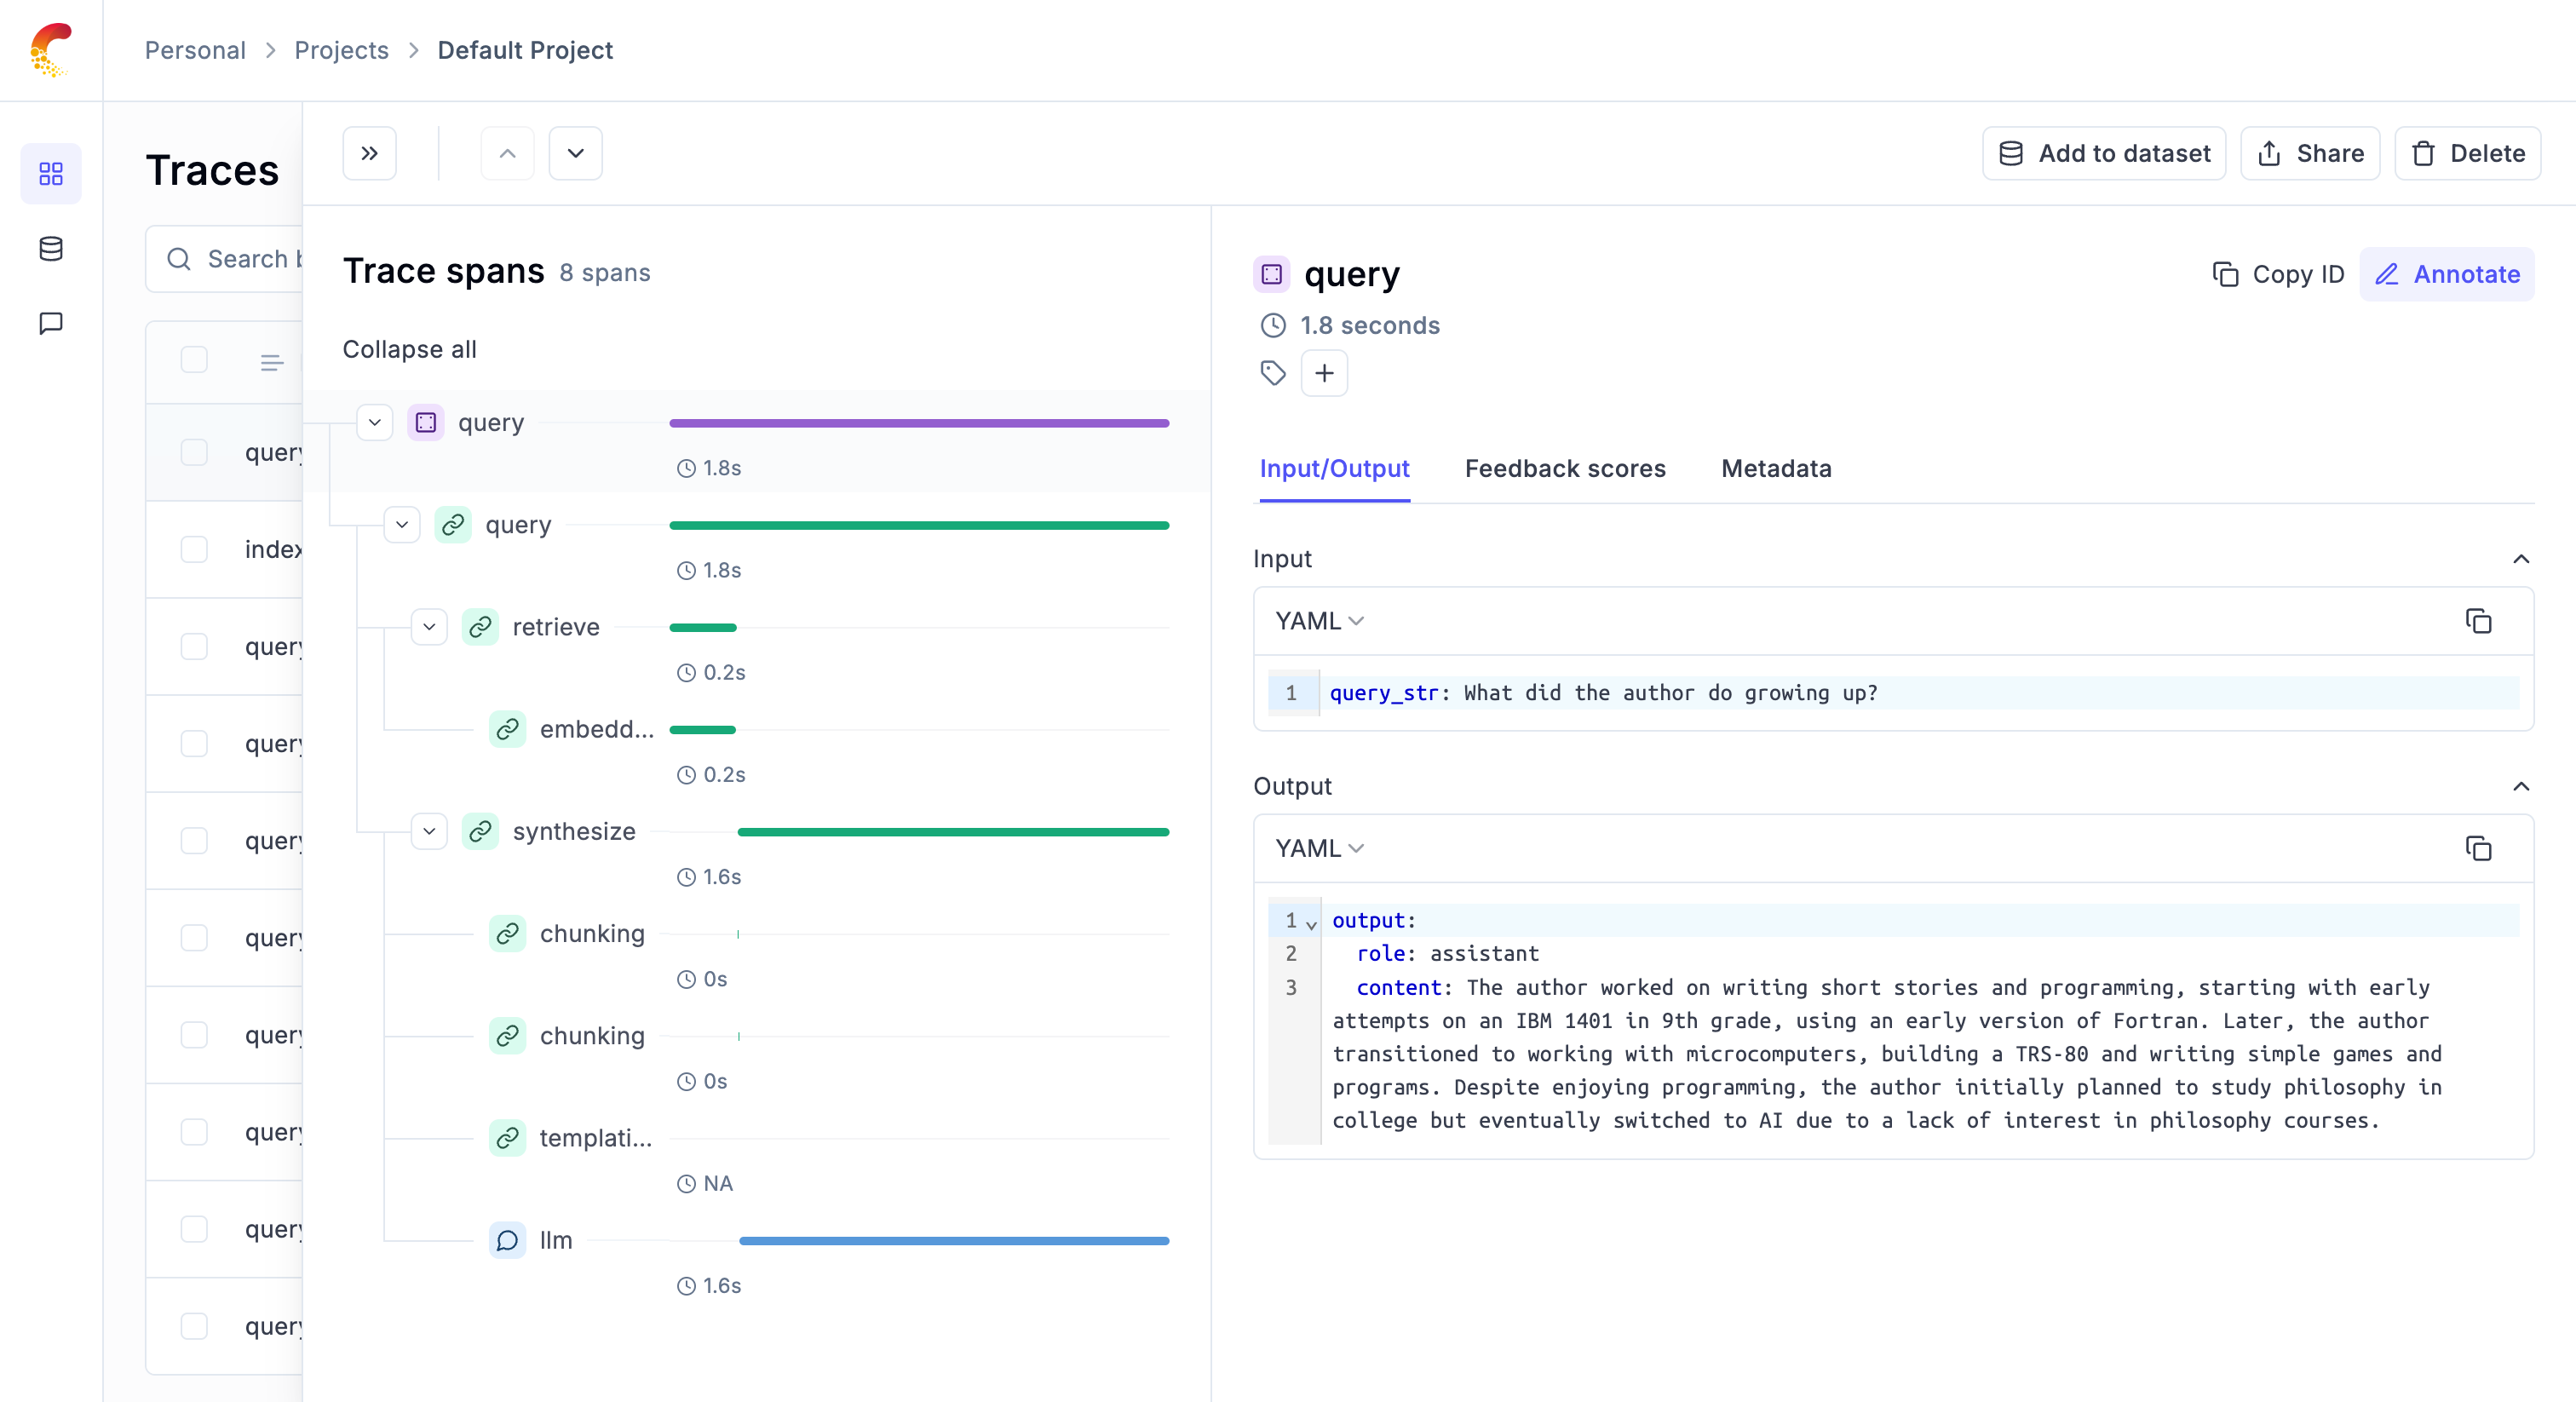
To showcase the integration, we will create a new a query engine that will use Paul Graham’s essays as the data source.
First step: Configure the Opik integration:
Second step: Download the example data:
Third step:
Configure the OpenAI API key:
Fourth step:
We can now load the data, create an index and query engine:
Given that the integration with Opik has been set up, all the traces are logged to the Opik platform:
Using with the @track Decorator
The LlamaIndex integration seamlessly works with Opik’s @track decorator. When you call LlamaIndex operations inside a tracked function, the LlamaIndex traces will automatically be attached as child spans to your existing trace.
In this example, Opik will create a trace for the my_llm_application function, and all LlamaIndex operations (like the LLM chat call) will appear as nested spans within this trace, giving you a complete view of your application’s execution.
Using with Manual Trace Creation
You can also manually create traces using opik.start_as_current_trace() and have LlamaIndex operations nested within:
This approach is useful when you want more control over trace naming and want to group multiple LlamaIndex operations under a single trace.
Tracking LlamaIndex Workflows
LlamaIndex workflows are multi-step processing pipelines for LLM applications. To track workflow executions in Opik, you can manually decorate your workflow steps and use opik.start_as_current_span() to wrap the workflow execution.
Basic Workflow Tracking
You can use @opik.track() to decorate your workflow steps and opik.start_as_current_span() to track the workflow execution:
In this example:
- Each workflow step is decorated with
@opik.track()to create spans - The
@stepdecorator is placed before@opik.track()to ensure LlamaIndex can properly discover the workflow steps opik.start_as_current_span()tracks the overall workflow execution- LLM calls within steps are automatically tracked via the global Opik handler
- All workflow steps appear as nested spans within the workflow trace
If you’re certain the workflow is a top-level call and want to create only a trace without an additional span, you can use opik.start_as_current_trace() instead of opik.start_as_current_span(). However, start_as_current_span() is more flexible as it works in both standalone and nested contexts.
Best Practices
- Decorate all workflow steps with
@opik.track()to capture each step as a span - Decorator order matters: Place
@stepbefore@opik.track()so LlamaIndex’s workflow engine can properly discover and execute steps - Use
opik.start_as_current_span()to wrap workflow execution - it works in both standalone and nested contexts - Configure the global handler to automatically track LLM calls within steps
- Use descriptive names for spans to make debugging easier
- Always call
opik.flush_tracker()at the end to ensure all traces are sent - Include input/output in span updates for better debugging
Token Usage in Streaming Responses
When using streaming chat responses with OpenAI models (e.g., llm.stream_chat()), you need to explicitly enable token usage tracking by configuring the stream_options parameter:
Without setting stream_options={'include_usage': True}, streaming responses from OpenAI models will not include token usage information in Opik traces. This is a requirement of OpenAI’s streaming API.
Cost Tracking
The Opik integration with LlamaIndex automatically tracks token usage and cost for all supported LLM models used within LlamaIndex applications.
Cost information is automatically captured and displayed in the Opik UI, including:
- Token usage details
- Cost per request based on model pricing
- Total trace cost
View the complete list of supported models and providers on the Supported Models page.