Observability for LangChain (Python) with Opik
Observability for LangChain (Python) with Opik
In Opik 2.0, datasets and experiments are project-scoped. Make sure to specify a project_name when creating datasets and running experiments so they are associated with the correct project.
Opik provides seamless integration with LangChain, allowing you to easily log and trace your LangChain-based applications. By using the OpikTracer callback, you can automatically capture detailed information about your LangChain runs, including inputs, outputs, metadata, and cost tracking for each step in your chain.
Key Features
- Automatic cost tracking for supported LLM providers (OpenAI, Anthropic, Google AI, AWS Bedrock, and more)
- Full compatibility with the
@opik.trackdecorator for hybrid tracing approaches - Thread support for conversational applications with
thread_idparameter - Distributed tracing support for multi-service applications
- LangGraph compatibility for complex graph-based workflows
- Evaluation and testing support for automated LLM application testing
Account Setup
Comet provides a hosted version of the Opik platform, simply create an account and grab your API Key.
You can also run the Opik platform locally, see the installation guide for more information.
Getting Started
Installation
To use the OpikTracer with LangChain, you’ll need to have both the opik and langchain packages installed. You can install them using pip:
Configuring Opik
Configure the Opik Python SDK for your deployment type. See the Python SDK Configuration guide for detailed instructions on:
- CLI configuration:
opik configure - Code configuration:
opik.configure() - Self-hosted vs Cloud vs Enterprise setup
- Configuration files and environment variables
Using OpikTracer
Here’s a basic example of how to use the OpikTracer callback with a LangChain chain:
The OpikTracer will automatically log the run and its details to Opik, including the input prompt, the output, and metadata for each step in the chain.
For detailed parameter information, see the OpikTracer SDK reference.
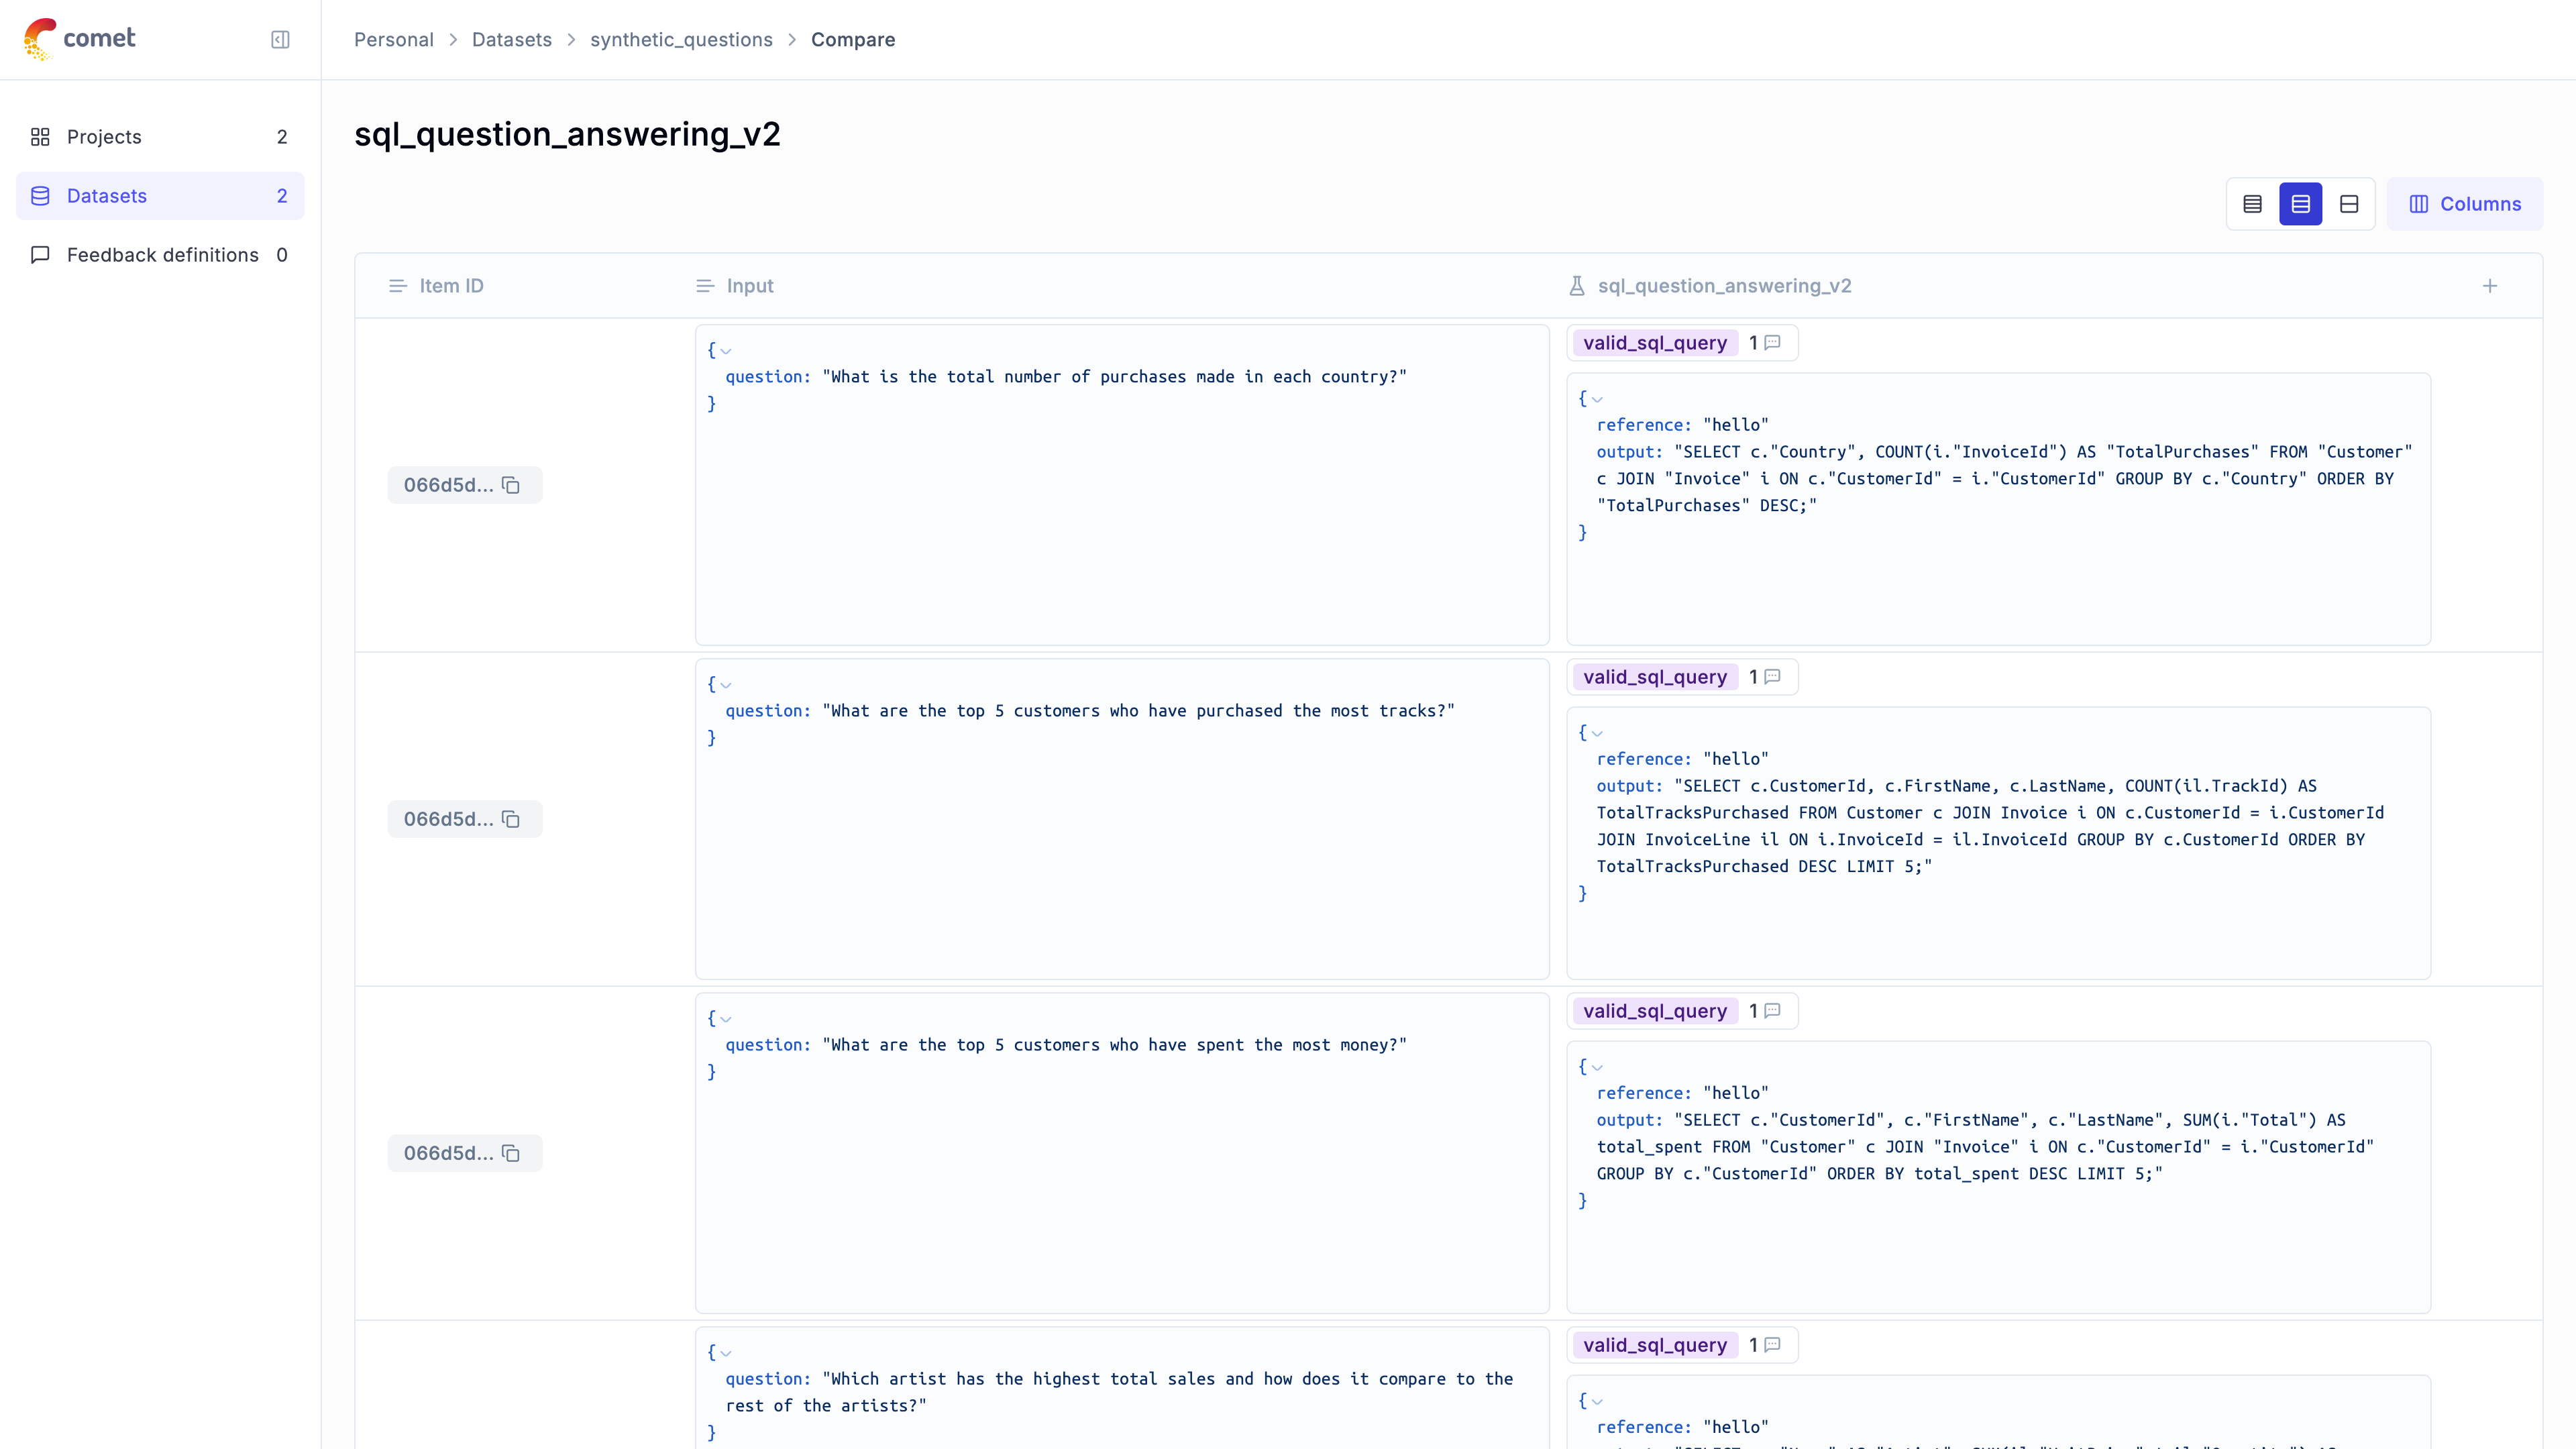
Practical Example: Text-to-SQL with Evaluation
Let’s walk through a real-world example of using LangChain with Opik for a text-to-SQL query generation task. This example demonstrates how to create synthetic datasets, build LangChain chains, and evaluate your application.
Setting up the Environment
First, let’s set up our environment with the necessary dependencies:
Creating a Synthetic Dataset
We’ll create a synthetic dataset of questions for our text-to-SQL task:
Building the LangChain Chain
Now let’s create a LangChain chain for SQL query generation:
Evaluating the Application
Let’s create a custom evaluation metric and test our application:
The evaluation results are now uploaded to the Opik platform and can be viewed in the UI.
Cost Tracking
The OpikTracer automatically tracks token usage and cost for all supported LLM models used within LangChain applications.
Cost information is automatically captured and displayed in the Opik UI, including:
- Token usage details
- Cost per request based on model pricing
- Total trace cost
View the complete list of supported models and providers on the Supported Models page.
For streaming with cost tracking, ensure stream_usage=True is set:
View the complete list of supported models and providers on the Supported Models page.
Using a proxy (LiteLLM, etc.)
When LangChain’s ChatOpenAI points at an OpenAI-compatible proxy (such as a LiteLLM gateway), cost tracking can break in two ways: the provider recorded on each LLM span defaults to the proxy’s hostname, which Opik doesn’t recognize and therefore can’t price; and the cost the proxy already computed isn’t captured.
Overriding the provider. Pass provider to OpikTracer so the backend can price the call. It accepts a string or an opik.LLMProvider:
If a single chain or graph mixes providers, pass a callable that returns the provider for each run. It receives a context with the model name parsed from that run, so routing is usually a one-liner. Return None to fall back to the auto-detected provider:
context.model is normalized by Opik, so this routing doesn’t depend on the proxy’s response shape. For advanced cases the raw LangChain run dict is also available as context.run.
Provider-reported cost passthrough. Some proxies return the exact cost of a request in a response header. OpikTracer captures it automatically and records it on the span, taking priority over Opik’s own estimate. LiteLLM’s x-litellm-response-cost header is supported out of the box.
For LangChain to expose those response headers to Opik, create the chat model with include_response_headers=True:
Settings tags and metadata
You can customize the OpikTracer callback to include additional metadata, logging options, and conversation threading:
Accessing logged traces
You can use the created_traces method to access the traces collected by the OpikTracer callback:
The traces returned by the created_traces method are instances of the Trace class, which you can use to update the metadata, feedback scores and tags for the traces.
Accessing the content of logged traces
In order to access the content of logged traces you will need to use the Opik.get_trace_content method:
Updating and scoring logged traces
You can update the metadata, feedback scores and tags for traces after they are created. For this you can use the created_traces method to access the traces and then update them using the update method and the log_feedback_score method:
Compatibility with @track Decorator
The OpikTracer is fully compatible with the @track decorator, allowing you to create hybrid tracing approaches:
Thread Support
Use the thread_id parameter to group related conversations or interactions:
Distributed Tracing
For multi-service/thread/process applications, you can use distributed tracing headers to connect traces across services:
LangGraph Integration
For LangGraph applications, Opik provides specialized support. The OpikTracer works seamlessly with LangGraph, and you can also visualize graph definitions:
Advanced usage
The OpikTracer object has a flush method that can be used to make sure that all traces are logged to the Opik platform before you exit a script. This method will return once all traces have been logged or if the timeout is reach, whichever comes first.
Important notes
-
Asynchronous streaming: If you are using asynchronous streaming mode (calling
.astream()method), theinputfield in the trace UI may be empty due to a LangChain limitation for this mode. However, you can find the input data inside the nested spans of this chain. -
Streaming with cost tracking: If you are planning to use streaming with LLM calls and want to calculate LLM call tokens/cost, you need to explicitly set
stream_usage=True: