“My life seemed to be a series of events and accidents. Yet when I look back, I see a pattern.” Benoit Mandelbrot
U-Net, a kind of Convolutional Neural Networks (CNN) approach, was first proposed by Olaf Ronneberger, Phillip Fischer, and Thomas Brox in 2015 with the suggestion of better segmentation on biomedical images.
The paper we’ll be exploring is U-Net: Convolutional Networks for Biomedical Image Segmentation
Why segmentation is needed and what U-Net offers
Basically, segmentation is a process that partitions an image into regions. It is an image processing approach that allows us to separate objects and textures in images. Segmentation is especially preferred in applications such as remote sensing or tumor detection in biomedicine.
There are many traditional ways of doing this. For example; point, line, and edge detection methods, thresholding, region-based, pixel-based clustering, morphological approaches, etc. Various methods have been developed for segmentation with convolutional neural networks (a common deep learning architecture), which have become indispensable in tackling more advanced challenges with image segmentation. In this post, we’ll take a closer look at one such architecture: u-net.
❓ In deep learning, it’s known that we need large datasets for model training. But there are some problems we run into at this point! We often cannot afford the amount of data that needs to be collected for an image classification problem. In this context, affordability means time, money, and most importantly, hardware.
For example, it isn’t possible to collect many biomedical images with the camera on your mobile phone. So we need more systematic ways to collect data. There’s also the data labeling process, for which a single developer/engineer will not suffice—this will require a lot of expertise and experience in classifying the relevant images. This is especially true with highly-specialized areas such as medical diagnostics.
Another critical point is to provide education about the general image in classically convolutional neural networks through class labels. However, some problems require knowledge of localization/positioning with pixel-based approaches. In areas that require sensitive approaches, such as biomedical or defense, we need class information for each pixel.
✔️U-Net is more successful than conventional models, in terms of architecture and in terms pixel-based image segmentation formed from convolutional neural network layers. It’s even effective with limited dataset images. The presentation of this architecture was first realized through the analysis of biomedical images.
🔎 Differences that make U-Net special!
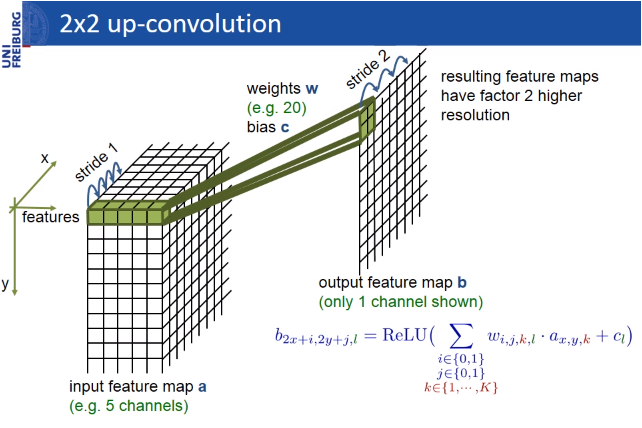
As it’s commonly known, the dimension reduction process in the height and width that we apply throughout the convolutional neural network—that is, the pooling layer — is applied in the form of a dimension increase in the second half of the model.
The pooling layer reduces height and width information by keeping the number of channels of the input matrix constant. The calculation is a step used to reduce complexity (Each element of the image matrix is called a pixel). In summary, the pooling layer refers to a pixel that represents groups of pixels.
Note: Pooling layers can work with different approaches, including maximum, average, or median layers.
These layers are intended to increase the resolution of the output. For localization, the sampled output is combined with high-resolution features throughout the model. A sequential convolution layer then aims to produce a more precise output based on this information.

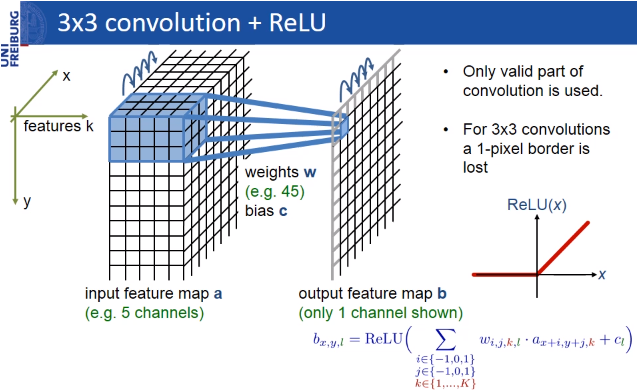
U-Net takes its name from the architecture, which when visualized, appears similar to the letter U, as shown in the figure above. Input images are obtained as a segmented output map. The most special aspect of the architecture in the second half. The network does not have a fully-connected layer. Only the convolution layers are used. Each standard convolution process is activated by a ReLU activation function.
U-Net consists of a contracting path (left side) and an expansive path (right side)!
🍭 You can read about activation functions in more detail here.
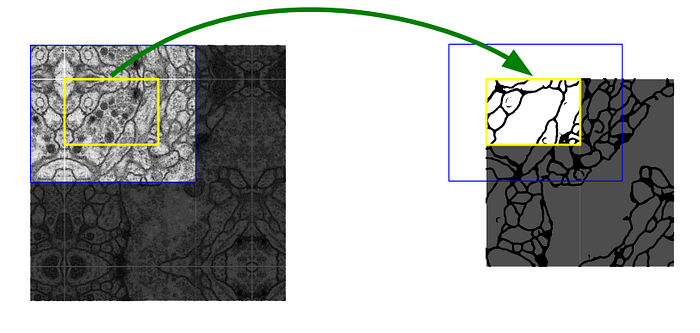
The pixels in the border region are symmetrically added around the image so that images can be segmented continuously. With this strategy, the image is segmented completely. The padding (pixel adding) method is important for applying the U-Net model to large images; otherwise, the resolution will be limited by the capacity of the GPU memory. The result of padding and segmenting with the mirroring I mentioned is shown in the figure below.
🐋The difference between U-Net and the autoencoder architecture
To help highlight what makes U-Net unique, it might be helpful to quickly compare it to a different traditional approach to image segmentation: the autoencoder architecture.
In a classical autoencoder architecture, the size of the input information is initially reduced, along with the following layers.
At this point, the encoder part of the architecture is completed and the decoder part begins. Linear feature representation is learned in this section, and the size gradually increases. At the end of the architecture, the output size is equal to the input size.
This architecture is ideal in preserving the output size, but one problem is that it compresses the input linearly, which results in a bottleneck in which all features cannot be transmitted.

This is where U-Net differs. U-Net performs deconvolution on the decoder side (i.e. in the second half) and, in addition, can overcome this bottleneck problem, which results in the loss of features through connections from the encoder side of the architecture.
🏊🏻Let’s continue with U-Net!
Let’s return to our specific use case at hand—biomedical image segmentation. The most common variation in tissue in a biomedical image is deformation, and realistic deformations can be efficiently simulated. In this way, the learning process is more successful with the elastic deformation approach, which helps us increase the size of our dataset.
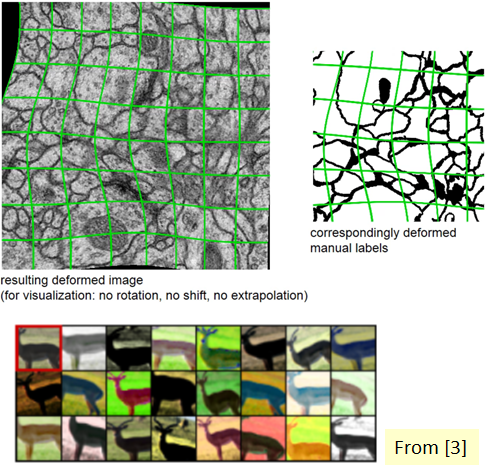
In addition, it’s difficult to determine the boundaries when there are parts of the same class that touches each other. For this purpose, it’s recommended to use the values that have a large weight in the loss function, while separating the information to be segmented from the background first.

📈 Loss Approaches
Loss can be calculated by standard binary cross-entropy and Dice loss, which is a frequently-used performance criterion for assessing success in biomedical images.


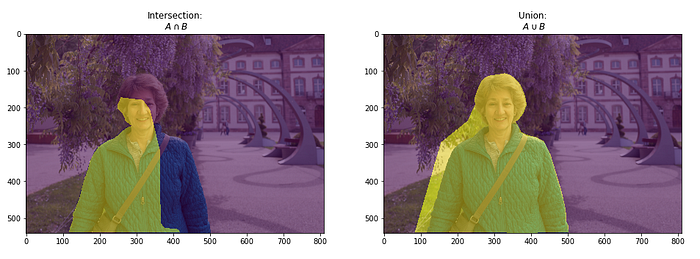
Intersection over Union (IoU) is a pixel-based criterion and is often used when evaluating segmentation performance.
The varying pixel ratio between the target matrix and the resulting matrix is considered. This metric is also associated with the Dice calculation.
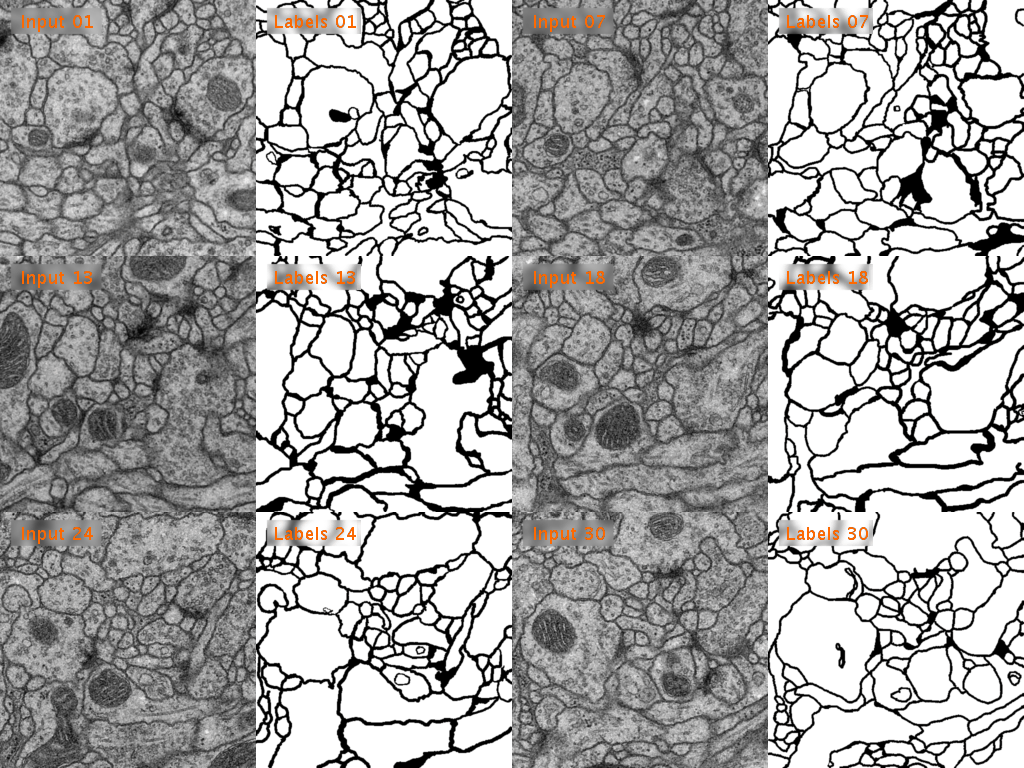
Here’s a look at how U-Net performs on EM image segmentation, as compared to other approaches:
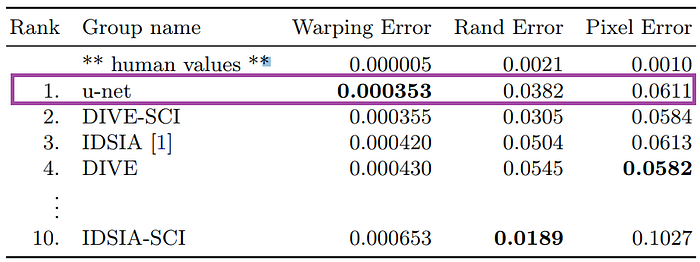
The success of the u-net architecture has been registered on different datasets. You can download the trained model here!
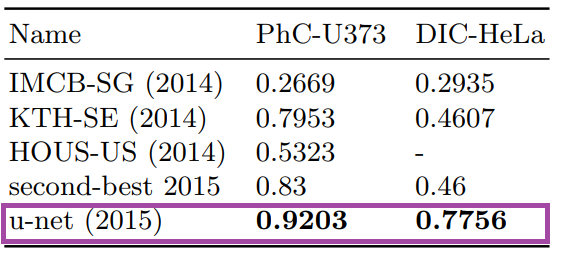
Results from PhC-U373 and DIC-HeLa datasets and comparison with previous studies:

Of course, segmentation isn’t only used for medical images; earth sciences or remote sensing systems from satellite imagery also use segmentation, as do autonomous vehicle systems. After all, there are patterns everywhere.
💎 It is also very important how the data should be labeled for segmentation. Sometimes you may encounter data that is not fully labeled or the data may be imbalanced. I recommend another practical resource written by neptune.ai, that you can review under these situations: How to Do Data Exploration for Image Segmentation and Object Detection (Things I Had to Learn the Hard Way)
🎧“Pattern” — with this song, let me continue to write 😅
🌋TGS Salt Identification Challenge
There are large deposits of oil and gas and large deposits of salt beneath the surface in various areas of the Earth. Unfortunately, it’s very difficult to know where the large salt deposits are.
Professional seismic imaging requires expert interpretation of salt bodies. This leads to very subjective, variable predictions. To generate the most accurate seismic images and 3D imaging, TGS (geology data company)hopes that Kaggle’s machine learning community can create an algorithm that automatically and accurately determines whether an underground target is a salt.
Here are some examples of successful u-net approaches:
🌎Mapping Challenge — Building Missing Maps with Segmentation
The determination of map regions by using satellite imagery is another u-net application area. In fact, it can be said that the applications that will emerge with the development of this field will greatly facilitate the work of mapping and environmental engineers.
We can use this method not only for defense industry applications but also for urban district planning applications. For example, in the competition for the detection of buildings (details of the competition can be found here), mean accuracy of 0.943 and mean sensitivity of 0.954 is reached. You can see the u-net model of this successful study here.


🔗 U-net’s inspiration for other deep learning approaches
U-net inspired the combination of different architectures as well as other computer vision deep learning models.
For example, the ResNet of ResNet (RoR) concept is one of them. The structure, which can be defined as the second half of the u-net architecture, is applied to the skip connections in classical residual networks.
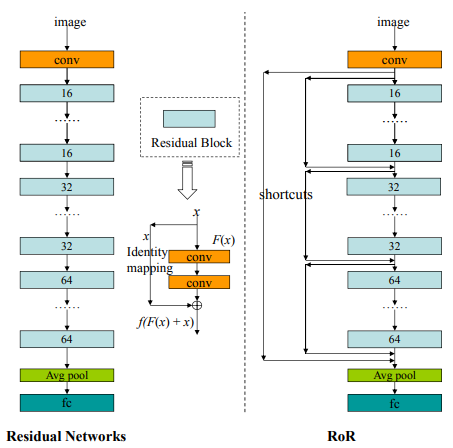
As can be seen from the classic ResNet model architecture, each blue block has a skip connection. In the RoR approach, new connections are added from the input to the output via the previous connections. There are different versions of RoR as in ResNet. Take a look at the various references at the end of this post if you want to examine the details.
- RoR-3 : Original ResNet use m = 3 for RoR
- Pre-RoR-3 : RoR, Before Activation ResNet m = 3 use
- RoR-3-WRN : RoR, m = 3 with WRN use
Conclusion
⚠️Segmenting images can be a challenging problem, especially when lacking enough high- and low-resolution data. It’s an area where new approaches can be developed by evaluating different, current, and old approaches.
Remember, biomedical imaging isn’t the only use case!
Other areas of application for segmentation include geology, geophysics, environmental engineering, mapping, and remote sensing, including various autonomous tools.

Deep Learning for Image Segmentation: U-Net Architecture by Merve Ayyüce Kızrak is licensed under a Creative Commons Attribution-ShareAlike 4.0 International License.
👽 You can also follow my GitHub and Twitter for more content!
🎀 I would like to thank Başak Buluz and Cemal Gürpınar for their feedback in the Turkish version of this post.
⚡️References
- U-Net: Convolutional Networks for Biomedical Image Segmentation
- ISBI Challenge: Segmentation of neuronal structures in EM stacks
- 5 Minute Teaser Presentation of the U-net
- Autoencoders, Unsupervised Learning, and Deep Architectures
- Pattern Recognition and Image Processing
- Medical-Imaging-Semantic-Segmentation
- Open Solution to the Mapping Challenge Competition
- Residual Networks of Residual Networks: Multilevel Residual Networks
- Evaluating image segmentation models