This article, written by Angelica Lo Duca, first appeared on Heartbeat.
For two months now I have been studying Comet, a platform for tracking and monitoring Machine Learning experiments. And, truth be told, I am truly amazed by the countless features Comet provides. I can truly say that every time I use the Comet dashboard, I always discover something new.
Today I would like to describe how to compare the results of two (or more) Machine Learning experiments through the graphical interface provided by the platform.
Comparing two or more experiments is really simple: with a few mouse clicks, you can understand which model performs best.
To illustrate the features provided by Comet, I will describe a practical example, which builds four classification models and chooses the best one.
The article is organized as follows:
- Loading the dataset
- Running the Experiments
- Comparing the Experiments in Comet
Loading the Dataset
As a use-case dataset, I use the NBA rookie stats, provided by data.world. The objective of the task is to use NBA rookie stats to predict if a player will last five years in the league.
Firstly, I load the dataset as a Pandas dataframe:
from comet_ml import Experiment
import pandas as pd
df = pd.read_csv('nba_logreg.csv')
df.head()
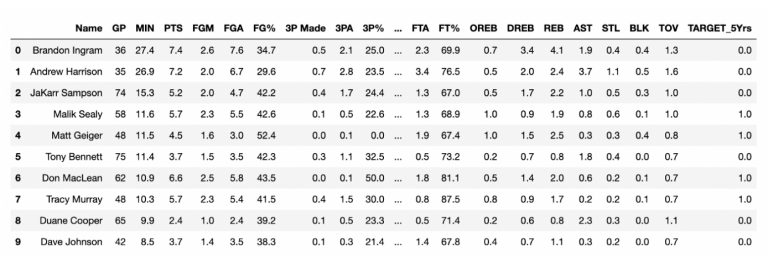
I have also imported the comet_ml library for further use. The following figure shows an extract of the dataset:

The dataset contains 1340 rows and 21 columns. I can use all the columns, but the Name and the TARGET_5Yrs columns, as input feature, and the TARGET_5Yrs as target class. Thus, after dropping the Name column and all the NaN values:
df.drop(['Name'], inplace=True, axis = 1)
df.dropna(inplace=True)
and converting TARGET_5Yrs column the to integer:
df['TARGET_5Yrs'] = df['TARGET_5Yrs'].astype('int')
I can build the Xand y variables:
X = df.drop(['TARGET_5Yrs'], axis=1)
y = df['TARGET_5Yrs']
Now, I can scale all the input features in the interval 0–1:
from sklearn.preprocessing import StandardScaler
scaler = StandardScaler()
X[X.columns] = scaler.fit_transform(X[X.columns])
Finally, I split data in training and test sets:
from sklearn.model_selection import train_test_split
X_train, X_test, y_train, y_test = train_test_split(X, y, test_size=0.20, random_state=42)
Running the Experiments
Now, I am ready to run the experiments. In this article, I do not focus on model optimization. Rather, my objective is to describe how to compare two or more experiments in Comet. For each experiment, I calculate the following evaluation metrics:
- precision
- recall
- accuracy
- f1-score
- confusion matrix.
I define an auxiliary function, that returns the first four metrics:
from sklearn.metrics import precision_score, recall_score, f1_score, accuracy_score
def get_metrics(y_pred, y_test):
    metrics = {}
    metrics['precision'] = precision_score(y_test, y_pred)
    metrics['recall'] = recall_score(y_test, y_pred)
    metrics['f1-score'] = f1_score(y_test, y_pred)
    metrics['accuracy'] =  accuracy_score(y_test, y_pred)
    return metrics
Now, I define another function, named run_experiment(), which builds a Comet Experiment, fits the model passed as an argument, calculates the evaluation metrics, and logs them in Comet:
from sklearn.metrics import confusion_matrixdef run_experiment(model, name):
    experiment = Experiment()
    experiment.set_name(name)

    with experiment.train():
        model.fit(X_train, y_train)
        y_pred = model.predict(X_train)

    with experiment.validate():
        y_pred = model.predict(X_test)
        metrics = compute_metrics(y_pred, y_test)
        experiment.log_metrics(metrics)
        experiment.log_confusion_matrix(y_test, y_pred)

    experiment.end()
In the previous example, I have also used the set_name() method provided by the Experiment class to set the name of the experiment to a more human-friendly string.
Now I can call the run_experiment() function with different models. Firstly, I test a Random Forest Classifier:
from sklearn.ensemble import RandomForestClassifier
model = RandomForestClassifier()
run_experiment(model, 'RandomForest')
Secondly, a Decision Tree Classifier:
from sklearn.tree import DecisionTreeClassifier
model = DecisionTreeClassifier()
run_experiment(model, 'DecisionTree')
Then, a Gaussian Naive Bayes Classifier:
from sklearn.naive_bayes import GaussianNB
model = GaussianNB()
run_experiment(model, 'GaussianNB')
Finally, a K-Nearest Neighbors Classifier:
from sklearn.neighbors import KNeighborsClassifier
model = KNeighborsClassifier()
run_experiment(model, 'KNeighborsClassifier')
Comparing the Experiments in Comet
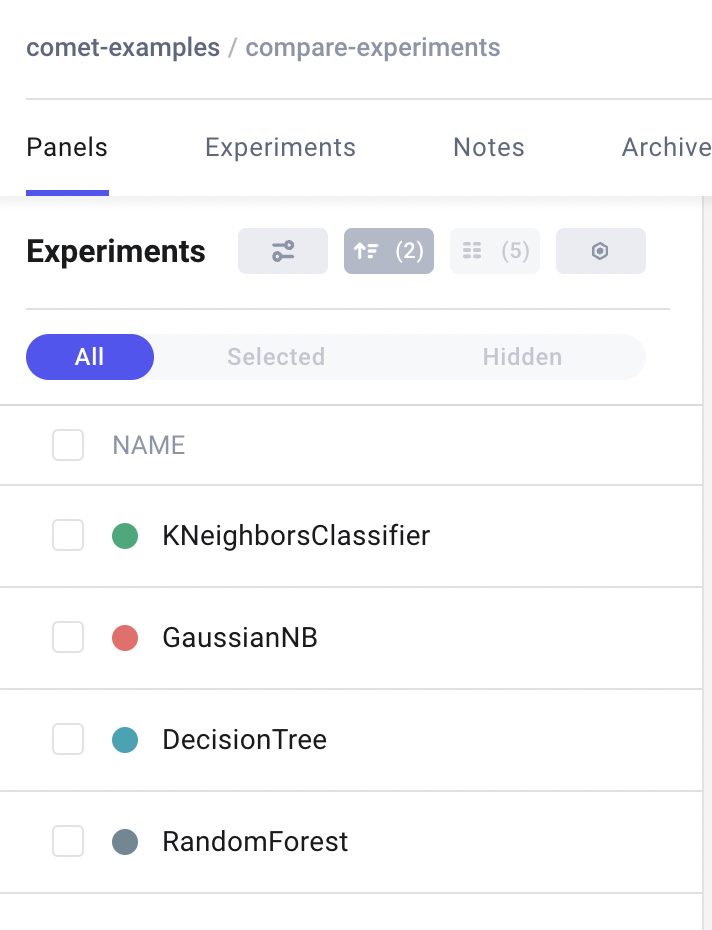
Once I have run all the experiments, I can check the results in Comet. From the main dashboard, I can see the four experiments:

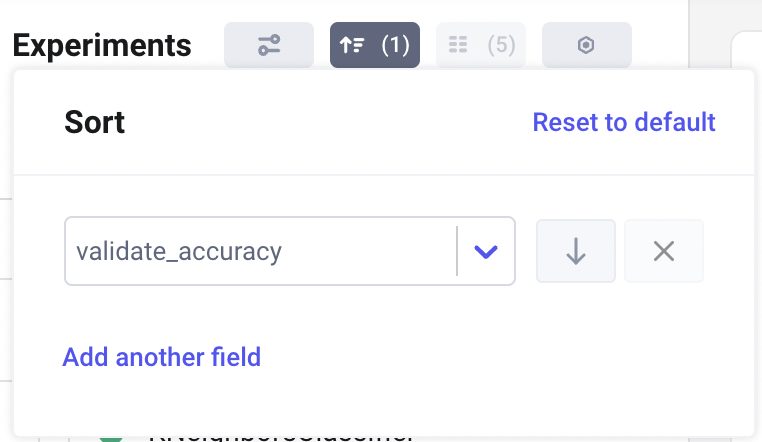
To choose the best model, simply I can click the sort button:

and choose the sorting criteria:

In my case, I choose to sort according to accuracy. I can also choose to order by ascending or descending order. In my case, I choose the descending order, thus the top model is the best.
If I click on the Experiments Tab, I can select the columns to show by clicking the columns button:

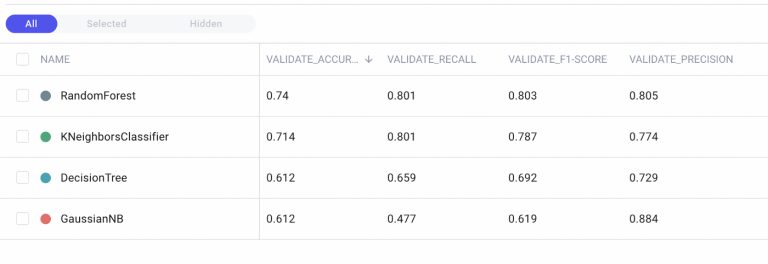
I select only the evaluation metrics to obtain the following table for comparison among experiments:

I note that Random Forest is the best algorithm in terms of accuracy. The extraordinary aspect is this operation is carried out in a few clicks, which in terms of time requires a few seconds. Through Comet you can shorten run time and make decisions faster.
Now that I have chosen the best model, I can move it to production through the use of Comet Registry. But that’s a whole other story…
Summary
Congratulations! You have just learned how to compare two or more experiments in Comet! The Comet dashboard is very simple, thus you can choose your best model in just a few clicks!
You can learn more about Comet by reading my previous articles: How to Build a Customized Panel in Comet and Hyperparameter Tuning in Comet.
