A Simple Recipe for LLM Observability

So, you’re building an AI application on top of an LLM, and you’re planning on setting it live in production. And thanks to the proliferation of frameworks and APIs, you’re able to prototype, test, and deploy faster than ever. Before you go to production, however, you realize you still have one problem to solve: How are you supposed to monitor this thing?
One thing I’ve learned over the course of 10+ years in production ML and AI, is the importance of monitoring these software systems. Despite our best efforts, models have a way of surprising us when they’re deployed. Once an LLM is in production and in the hands of our users, we want to be proactively alerted to any disruptive behavior or bugs so we can preemptively resolve them before there is significant negative impact. Yet monitoring LLMs is complex, and although best practices can overlap and borrow from traditional software development, there are some fundamental differences.
Why Monitoring LLMs is Different
Production issues with an LLM look quite different from the issues that arise in traditional software. The LLM itself is now a component of the software architecture that needs to be monitored. These models are nondeterministic by nature, meaning that their output is probabilistically generated and there is natural variability expected in the results, resulting in strange behavior issues we’ve never seen in software. Traditional software, for example, doesn’t hallucinate or generate biased content. So LLMs have different failure points, and because of this, a different approach and set of tools is required to provide complete monitoring coverage to safeguard these models against their potential failure points.
As LLMOps matures, we are discovering the exact monitoring paradigms we should implement before we flip the switch to live. As developers, we want to keep tabs on the health of our apps and proactively monitor for potential issues. We’d also like to visualize the behavior in a nice dashboard. That is actually really challenging with LLMs because of the nondeterministic nature of their output. For example, traditional software will throw an error when it fails—at least, hopefully. Your LLM, on the other hand, isn’t going to tell you if it’s hallucinating. As a result, we have to be thoughtful about what we measure to assess the health of our system, and it can be very difficult to develop and generate the right set of numeric metrics to monitor the LLMs behavior online at scale.
In this article, I will propose metric categories that must be considered before your LLM goes live, and provide a framework using OSS tools to configure a full coverage monitoring and debugging strategy. I’ll be using OpenAI’s SDK and Opik and providing easy copy paste coding samples so you can customize this monitoring strategy in your own apps. I was surprised by how quickly I was able to stand up production quality monitoring for a real LLM app using open source tools. This tutorial may look simple, but don’t be fooled – a few lines of clean code can actually build a powerful and meaningful product!
If you’re looking to personalize a monitoring strategy for your own LLM app, this tutorial will give you some ideas about what you should be monitoring for, as well as provide a code example that can easily be customized to fit a monitoring strategy that is specific to your needs. And if you do use this monitoring strategy or code for your own projects, I’d love to see what you built! Please tag me in your projects if you post about them on LI, or drop your Github in the comments down below.
Monitoring Strategy for LLMs
So what are these unique failure points specific to live LLM models? What should we be worried about once our LLM project is live? I propose three categories of online metrics that should be considered for monitoring: Cost, Quality, and Output.
Cost Metrics
Running LLM inference can be expensive. Every call a customer makes to your app is likely one or multiple calls to an LLM model. Whether that model is hosted internally on your servers, or an API from an LLM provider like OpenAI, that call is going to cost you some $. Costs can escalate quickly, especially with high API usage, frequent model queries, and large inference workloads. So monitoring your cost metrics is crucial for maintaining ROI on your project.
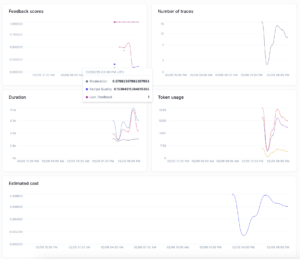
I typically monitor for the following cost metrics:
- Number of Traces
- Duration
- Token Usage
- Estimated Cost
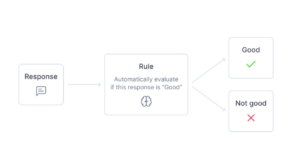
Quality Metrics
Because we’re working with AI and not just a cut and dry software tool, the definition of quality becomes a bit complex. LLMs are known to do strange things like hallucinate, or go off the rails and start producing harmful or inappropriate content. So, quality here means keeping the AI operating within its expected boundaries. We have to consider metrics to perform moderation and detect hallucinations as fundamental pieces of the monitoring puzzle. Often, engineers and data scientists build guardrails into AI software to mitigate these kinds of risks and ensure the safe, ethical, and responsible use of AI. Without guardrails, LLMs can generate misinformation, biased responses, offensive content, or security vulnerabilities that bring harm to your product or business. Yikes.
Guardrails can be implemented in a couple of different ways. Typically, they involve some logic to programmatically block inputs or outputs that are detected as harmful. Often, guardrails will also be coupled with human in the loop intervention. Alongside guardrails, it is also important to design a mechanism of gathering insights to improve model performance iteratively, like collecting user scores.
Luckily Opik has these LLM quality and feedback metrics built-in, making it easy for you to apply them to your project as well as customize additional metrics.
I typically monitor for the following quality metrics:
- Hallucinations
- Moderation
- User Feedback Scores
Custom Output Metrics
The output of LLMs can vary due to the nondeterministic nature of these models we discussed earlier. If you’re interested in learning more about that, I have an article that covers it here. Because of this, there can be variability and errors in the output that are specific to our use case, and difficult to detect with an out of the box standard metric.
I typically monitor for my output using a custom “LLM as a Judge” metrics. In the example below, I’ll show you how I used Opik to create a custom prompt to generate a metric that measures the usefulness and accuracy of my very specific output in the context of the application.
Building an LLM Observability System with OpenAI and Opik
Okay great, so I have a good monitoring strategy in place that can be easily customized to my project, while still covering the bases of what could go wrong with an LLM in production. But how do I implement it? I used the OpenAI SDK and Opik python SDK to do this, but you could create something similar with many different model providers and OSS observability tools.
You can also use the Opik dashboard to review your metrics, feedback scores, trace count and tokens over time at both a daily and hourly granularity. Then, when a production issue is detected, you can debug and troubleshoot the issue by exploring the trace data you logged to Opik. So this is the perfect tool to provide both easy integrations into my existing project code, as well as give me an UI to keep an eye on my metrics and inputs and outputs once my project is live. And the thing I really liked about it as a developer who loves to tinker with personal projects, is that after my AI app was completed, I was able to get Opik integrated and up and running in under an hour. It was only a few lines of code to configure the logging and personalize the metrics and monitoring strategy.
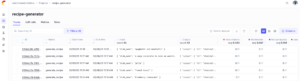
Example Recipe Generator Project with Reproducible Monitoring Code
 The best way to learn AI is to tinker with it hands on. So I built a working LLM recipe generator to assist me with my home cooking endeavors, and I set up a custom end-to-end monitoring strategy to ensure the system stays within budget and operates as expected.
The app is quite simple, and can be run in a jupyter notebook. The user simply enters a query for a dish, and the prompt instructs it to return a recipe that can reasonably be executed by a home chef like you or I.
If you’d like to reproduce my project exactly, I’ve shared all the code here: Monitoring LLM Systems in Production with Comet Opik.ipynb
@opik.track(flush=True)
def generate_recipe(dish_name):

    prompt = f"""
    You are a world-class home chef and recipe developer. Generate a step-by-step recipe for {dish_name}.
    Include a list of ingredients with quantities, clear cooking instructions, preparation time, cooking time, and serving size.
    If applicable, provide useful tips, optional variations, or suggestions for substitutes.
    Keep the recipe straightforward and easy to follow for a novice at home cook.
    """

    # Request recipe generation from OpenAI's completions model
    response = openai_client.chat.completions.create(
        model="gpt-3.5-turbo",
        messages=[
            {"role": "system", "content": "You are a world-class chef and recipe developer."},  # system message
            {"role": "user", "content": prompt}  # User's input prompt
        ],
        max_tokens=500,
        temperature=0.7,
        n=1
    )

    # Add user feedback score to the trace in Opik
    opik_context.update_current_trace(
    feedback_scores=[
        {"name": "user_feedback", "value": 1.0, "reason": "It looks good."}
        ]
    )

    return response
I’m using the OpenAI SDK to make a simple call to gpt 3.5 turbo. Here I can configure the model used and prompt as well as define model parameters such as the temperature and max tokens.
Then, I use the Opik OpenAI integration with the @track decorator to seamlessly integrate the metrics collection as well as logging traces.
The inference step for my app is equally as simple. I simply enter the name of a dish and run the code to generate a recipe.
# Example usage
dish_name = "cheddar dill biscuts like at red lobster. It should include milk and 3 eggs. the butter is melted. No baking powder. 4 cups flour. instant yeast"
recipe = generate_recipe(dish_name)

#extract just the recipe text and print
print(recipe.choices[0].to_dict()['message']['content'])
OPIK: Started logging traces to the "recipe-generator" project at https://www.comet.com/opik/statisticianinstilettos/redirect/projects?name=recipe-generator. **Cheddar Dill Biscuits** **Ingredients:** - 4 cups all-purpose flour - 1 packet instant yeast - 3 large eggs - 1 cup milk - 1 cup melted butter - 1 cup shredded cheddar cheese - 2 tablespoons dried dill - 1 teaspoon salt **Instructions:** **Preparation Time:** 20 minutes **Cooking Time:** 15-20 minutes **Serving Size:** 12 biscuits 1. Preheat your oven to 375°F (190°C) and line a baking sheet with parchment paper. 2. In a large mixing bowl, combine the flour, instant yeast, shredded cheddar cheese, dried dill, and salt. Mix well to combine all the dry ingredients. 3. In a separate bowl, whisk together the eggs, milk, and melted butter until well combined. 4. Make a well in the center of the dry ingredients and pour the wet mixture into it. Use a spatula to gently fold the wet and dry ingredients together until a soft dough forms. Do not overmix. 5. Turn the dough out onto a lightly floured surface and gently knead it a few times until it comes together. 6. Roll out the dough to about 1-inch thickness. Use a round cookie cutter or a glass to cut out biscuits from the dough. 7. Place the biscuits on the prepared baking sheet, leaving a little space between each one. 8. Bake in the preheated oven for 15-20 minutes, or until the biscuits are golden brown and cooked through. 9. Remove the biscuits from the oven and let them cool slightly before serving. **Tips:** - Be gentle when mixing and kneading the dough to ensure a light and fluffy texture. - Feel free to add more cheese or dill according to your taste preference. - Serve the biscuits warm with butter or your favorite spread. Enjoy your delicious homemade Cheddar Dill Biscuits that are reminiscent of the ones served at Red Lobster!
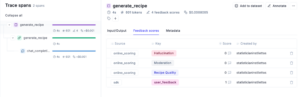
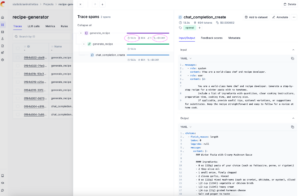
Traces and Spans
When an inference call is made, Opik automatically tracks cost metrics as well as logs all the data about the OpenAI model and inference call easily through the built-in integration. Using one of the Opik integrations is the easiest way to get started with LLM Observability if you’re building with one of the providers they have listed. Using the @track decorator allows you to track not just LLM calls but any function call in your application, and it is often used in conjunction with the integrations.
Logging the traces and spans provides visibility into your inputs and outputs of every call. This ability to look under the hood is not only excellent during development, but it is useful in production too. I can use this to pinpoint and debug issues, and the metrics I’ve defined in my monitoring strategy are going to be calculated and assigned to traces and spans to give us the full picture.
Metric Monitoring
Here is my monitoring metrics strategy for this specific application.
| Cost | Quality | Custom Output |
|
|
Custom “LLM as a Judge” metric for recipe accuracy |
Cost Metrics
The Opik OpenAI integration automatically tracks the cost metrics I care about as it’s been designed to track and monitor costs for your LLM applications by measuring token usage across all traces. I automatically see metrics for duration and cost on the span and trace levels. This allows me to see right away if a specific call is costing me too much, and pinpoint exactly where this occurs within the trace.
Then, you can use the Opik dashboard to review costs at three levels: spans, traces, and projects. Each level provides different insights into your application’s cost structure. Awesome so I can see it on an individual trace, which will allow me to pinpoint a problematic call in prod, but i also want to monitor it over time and being able to visualize it would help quite a bit with keeping tabs on my robots in prod.
Quality Metrics
Opik allows you to create metrics for hallucination hallucination and moderation easily. These can be configured as online metrics to evaluate inference events. The configuration can be done through the UI , or programmatically. Notice that these metrics are evaluated in real time with each trace that is logged to the Opik system. They appear in the “feedback scores” tab so they can be evaluated alongside the logged inputs and outputs.
To test if these metrics will assist me in identifying potential issues and applying the proper guardrails to the system, I had to ask my application for a few unsavory recipes. Notice that our online evaluation metrics for Moderation caught the most troublesome of these, while the Recipe Quality metric flagged another.

Custom Output Metrics
Because this is a recipe generator, I have some specific concerns about the output. I want to make sure the recipe proportions, cooktime, and techniques are all reasonably accurate. How do I measure and test for that, and how do I get a numeric metric to monitor with written text output?
Easy. The answer is LLM as a judge. If you’re not already familiar with LLM as a Judge metrics, I’ll give a quick recap. It is the wild concept of using another call to an LLM to judge the output of your LLM. The LLM as a Judge metric uses a prompt to force a metric to be returned to score, or “judge” the content of the output. Because the metric is actually just a prompt, it is completely customizable.
This may seem like a strange way to create a metric, especially to any of my mathematically minded colleagues, and it is. But it is also creative and customizable. And these evaluations can return more than just a metric, you can also instruct it to provide a reason or the score it assigned, which assists developers in debugging issues. So we should just use it with knowledge of its limitations due to LLM’s known limitations to make direct mathematical calculations.
My Recipe Quality metric is a totally custom metric that was lightning fast to implement in Opik. Using the “rules” functionality, I was able to design a perfectly tuned to catch potential issues that could arise for my project. I had fun being creative and gave my metric the personality and asked it to judge the recipe based on what Gordon Ramesy may think.
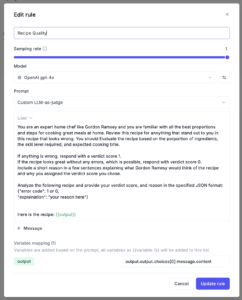
LLM as a Judge metrics can be expensive to implement on all your production traces. ButOpik addresses this by allowing the user to select a sampling rate, making it efficient to apply these at scale.
Adding Observability to your LLM Application
I hope this article has helped demonstrate the importance of considering custom monitoring strategies beyond what we’d traditionally consider in the context of software monitoring, and provided so easy copy-paste code to get you started on your own monitoring strategy. T
The real-time monitoring I just discussed is just one piece of the puzzle when we’re thinking about monitoring and improving your LLM application. Annotating and labeling output with human feedback and leveraging it to retrain your model or refine your application is also key. Implementing guardrails to take specific action with metrics breaching a desired threshold is another thing to consider.
If you use the simple cost/quality/custom-output monitoring strategy I laid out in this article for your own project, or implement some different form of monitoring with Opik, I’d love to see your approach. You can connect with me on LI and Twitter, and share your work, or drop comments on this post to start the discussion.
I can’t wait to see what you build! 🚀💫
Related Articles